
The family of IDEs based on the IntelliJ Platform (e.g. IntelliJ IDEA and PyCharm) is a project that spans 22 years of history, includes ~30M lines of Java and Kotlin code, and has been supported by hundreds of contributors.
This talk reveals the internal development processes and DPE practices used by JetBrains to ship the company’s largest project suite. You will hear how JetBrains dog-foods its own technologies (TeamCity, YouTrack, Space, Toolbox Enterprise) for development, QA, and deployment, as well as some of the custom tools used at JetBrains to increase productivity.
Developers use an IDE to be more productive, using time-saving features like fast access to code, shortcuts, and plugins. Yet developer productivity is often compromised by deploying a large monorepo. Factors like high memory consumption, protracted indexing processes, and the need to manage large file systems and thousands of fine-grained modules, often cause your IDE to operate at a snail’s pace, if it doesn’t break down completely.
Learn how the IntelliJ IDEA team is exploring DPE concepts to mitigate some of the major disadvantages of monorepo environments. Approaches discussed include reducing the working scope of the codebase, remote development practices to speed up the environment, and parallelizing work to a CI server with pre-generated indexes.
Dmitry Jemerov is a JetBrains veteran who has worked on many products including IntelliJ IDEA, PyCharm, RubyMine, Kotlin and more. His current role is Head of Product in the IntelliJ department.

Gradle Enterprise customers utilize Gradle Enterprise Build Scan® to rapidly get deep insights into the state of monorepos with various DPE metrics and concerns, like build and test performance, flaky tests, dependencies, failures, and regressions. Additionally, build and test performance acceleration features, including Build Cache, Predictive Test Selection and Test Distribution, address the pain of slow builds and excessive context switching due to avoidable disruptions to the developer’s creative flow. Learn more about how these features can help you boost productivity by starting with a free Build Scan for Maven and Gradle Build Tool, as well as watching videos, and checking out our free instructor-led Build Cache deep-dive training.
Check out these resources on keeping builds fast with Gradle Enterprise.
-
Watch our Build Scan™ Getting Started playlist of short videos to learn how to better optimize your builds and tests and to facilitate troubleshooting.
-
See how Test Distribution works to speed up tests in this short video.
-
Sign up for our free training class, Build Cache Deep Dive, to learn more how you can monitor the impact of code generation on build performance.
Dmitry Jemerov: Yeah, Hey. Hello everyone. So today I’m going to talk a little bit about how we at JetBrains the company who builds the developer tools that many of you use, how we ourselves use our internal tools. And we don’t really talk about that all that often we talk about the tools themselves, but we don’t share a lot of information about how we apply them internally and so now you actually get to learn about this stuff. So my formal role at the company now is the Head of Product for the IntelliJ department, but I also have been doing a lot of technical work and still doing technical work, so I’m also talking about the tools that I use myself. So we’ll basically run through all the stages of how the development process for IntelliJ works, how the repository is set up, how the local development works, what happens on CI and then what after that how we do code reviews, how we track issues and what tools we use for static analysis.
So let’s start with the repo. So the scope of what I’m going to be talking about is the repository that contains all IntelliJ-based IDEs along with Fleet and some non-bundle plugins. So different projects like Space or TeamCity or YouTrack use different repositories, so we don’t have a company-wide monorepo but it’s like the IDE monorepo. It has continuous history since 2005. So basically at JetBrains we used all the version control systems in existence so we started with the visual SourceSafe, we use StartTeam we use CVS. This is lost to the midst of time, the history of from that time, but then in 2005 we switched to Perforce and then we used a combination of Perforce and Subversion, and at some point we migrated to Git and so this we have the history with… In Git from the 2005. All in all it’s 20 gigs of data, more than 1 million commits, 10 million lines of Java, four point something million lines of Kotlin, and a bunch of other stuff like Groovy, JavaScript, Python and others.
And all in all we have a few Hardware developers working on the repository on a day-to-day basis. The solution that we use for hosting the Git repository is Space. So Space is basically our new product that is kind of our answer to GitHub but also more than that, so it’s essentially a set of tools that includes everything that a company needs to automate their software development activities. So hosting code review CI/CD and a lot of other stuff. We are not using all of that for IntelliJ, so I’ll be talking about the specific parts that we use for IntelliJ development. And the first one like as I mentioned already is the Git hosting. So Space has a fairly nice architecture for Git hosting is distributed, it bears the load of approximately 10 fresh requests per second, continuously coming mostly from build agents. It takes care of the repository maintenance for us. And we also have the open source part of the repository mirror to GitHub using some custom tools that we have built. So this basically shows like what the Space UI for working with version control looks like, nothing too fancy here. I guess you can imagine what it looks like. Now I’m going to briefly talk about our branching policies, so this is one of the this is like…
Basically the way our development process is structured, we do a lot of things not in the way that is kind of considered best practices in the industry, and some of these are just basically historical aspects and some of these basically are our own choices appropriate to the environment we are in, and then also I’m going to highlight some of the things where we are not doing the what’s most other people do. And one of the things that we don’t do is we don’t do continuous delivery, and I think that most people actually wouldn’t want us to do continuous delivery. They want the IDE updates to be somewhat like controlled and managed, so our four month release cycle I think it works quite well for most of the people. So how this maps to our branching policy is that we have the master branch for ongoing development with a linear history so we don’t do merge commits. And basically the master branch should be stable enough so that every day people can build a nightly…
Can use the nightly build for their own development and approximately half of the team I think uses nightly builds for their day-to-day work, and some people even build their own IDE from Sources. And we are generally managing to have that, so sometimes we have builds that are marked as broken and so they are skipped from the automatic update period but all in all like the master branch is stable for day-to-day use. For releases, we create stable branches, so every branch… So like basically every four months we create a stable branch for the way of releases of all the IDEs, they are created six weeks before release and this six weeks is basically the stabilization period and bug fixing period for that branch. And also for every specific release we also have a distinct branch like for example this 222.4345 build, this is a branch in which one single build is stabilized, usually it contains only a very small number of commits, but we still need to make sure that we have the ability to have bug fixes for one specific build that is about to be released.
And those weekly builds go out to the public so these are the EAP and the bug fix update builds. EAP is our Early Access Preview program basically it gives early access to the builds that are about to be released. And generally speaking the team doesn’t use the feature branches all that much, so there’s no like policy prohibiting that, but in general we prefer to have feature flags, so we actually prefer to do the continuous integration as it was originally prescribed by the leaders of the… By the people who have introduced this concept so we actually really like all of the work to be integrated in master all the time. And if something is not ready we usually have just a flag that turns off a particular feature for external users.
But still all that we don’t want to have long lift feature branches and then suffer through the merge conflicts when the branch is merged into master. So how does a local development environment set up works. Actually with IntelliJ idea, the process is surprisingly simple, so we don’t use any of the VM or container or anything like that. So basically all you need to do is you need to install Git and the Toolbox app. You log into Toolbox Enterprise, which I’m going to talk about in a short bit. You install IntelliJ, you clone the project, and basically that’s it. So the IDE takes care of downloading all the dependencies and the JDK and essentially everything you need to work. So what’s Toolbox Enterprise? Toolbox Enterprise is our new product that we are right now introducing that allows you to manage a fleet of JetBrains IDEs installed across your organization. It allows you to specify which builds are approved for use. It allows to define common plugins and settings that should be available for everyone on the team. And it also collects telemetry data from developer machines and provides reports to admins so that admins can actually be aware of how productive developers are, where they waste time, where they encounter freezes or problems, things like that.
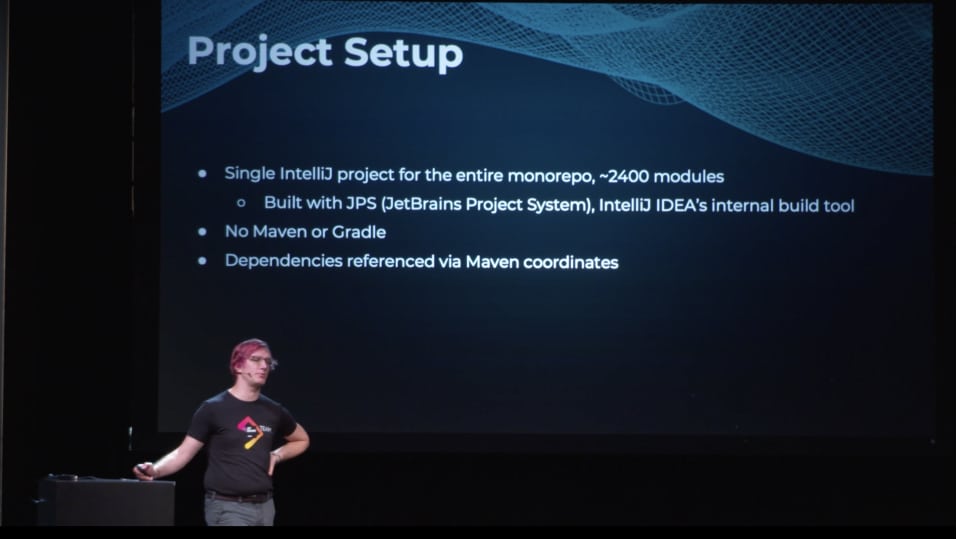
So if you curious about Toolbox Enterprise, like Eugene, the team lead of TB is here on the event, and you can talk to him or to me to find out more about it. In order to compile the project, we actually don’t use Maven or Gradle. We have our own built system. JetBrains project system is basically a way to build IntelliJ products in an automated way. So we have a single product for the entire monorepo is like 2400 modules. And we actually really like the setup where we don’t have Maven or Gradle, we don’t need to wait through the syncs. When you have the project is updated, the builds up fast. And actually we are really happy with the experience that we have, and the dependencies, our reference to Maven coordinates. So IntelliJ automatically takes care of downloading them or updating them when the versions need to change.
And one other part where we use Space, we use Space for hosting the non-public dependencies. For example, the licensing code as a separate library that lives in Space packages and it’s referenced by the commercial IntelliJ project. And in order to run IntelliJ, we use a large set of shared run configurations that contain all the settings that are necessary to launch a given IDE or an IDE with a given set of plugins. This shows basically the projects structure configuration UI. So you see that basically all the modules, all the dependencies between modules and libraries are defined through the UI or they actually stored on XML files that you may want to edit manually. In some cases, we just edit their raw XML files instead of going through the UI. And of course we have a lot of IDE assistance features to help us manage the dependencies and add them automatically when needed.
And this is just a small subset of the set of a shared run configurations in the IntelliJ project showing all the things that you can run all the IDEs that are that leave in our monorepo. As everyone else, we kind of suffer from the pain of indexing. Indexing takes some amount of time, and we have… The solution that we have built for this to alleviate this pain is shared indexes. So basically we have a public infrastructure for the libraries that are shared, that are published to Maven Central and for the JDKs. So everyone can tell their, the IDE actually automatically suggests to download these shared indexes. And also for our own code, we have index… We have like project indexes. This is like a commercial only feature for IntelliJ.
So basically we build shared indexes on TeamCity. And the IDE downloads them automatically, so that it can use those indexes instead of running the indexing process locally. And for us, it reduces the indexing time from 7 minutes to 1 minute. And this 1 minute it’s also going to go down, thanks to a project that we are working on right now called Turbocharge Shared Indexes. This will basically just allow to mount a downloaded index chunk into a running IDE without any intermediate… Without any additional process to hook things up that takes 1 minute in the current setup. So with that, the indexing time will be reduced to the time of downloading the shared index chunk.
Ooops. This is the IDE configuration page for shared indexes. You have that in your own IDE as well, and you can basically, you can apply shared indexes for the Maven Libraries and JDKs, and you can also set up a process on your CI to build a shared indexes for your product code. So the local build, as I said, we don’t use Maven or Gradle. So the local build uses our own build system. A clean rebuild takes, on a fast machine like on a Fast Linux server, it takes like 15-20 minutes. But normally this does not happen all that often. So normally you need to do that if someone advances the version of some core dependency or the version of some internal data structures. So this usually happens at most a few times a week. And an incremental build after exchange usually takes like 5-10 seconds if the change is small. Of course, if you make a larger scale change you need to wait longer. But basically this is as short as the round trip gets when you are developing IntelliJ. And in order to make the development even faster you don’t always have to restart IntelliJ after you make a change.
So Java supports hot swap as you probably know that allows you to load changes of classes into running program. And our own JetBrains version of the Java Runtime includes something called DCEVM, Dynamic Code Evolution Virtual Machine, I think it’s called. It’s basically like a set of extensions to the hot swap features that allows you to… The hot swap not only changes to method bodies, but also changes to the structure of the code, like if you add the method or change the signature of a method, you can still hot swap these kinds of changes if you use the DCEVM. So this reduces the round trip type even further.
One other thing that we build to reduce the compilation time is called JPS cache. So this is our internal solution. This is not something that you can apply to your own project, but this is actually quite tightly coupled to our build system and our CI. So what it does, it allows you to download the set of classifiers and incremental compilation caches from CI. So basically every time we’re on a build on CI, we generate, of course it generates classifiers, but it can also generate these incremental compilation caches that allows the IDE then to know everything about the state of the code that was compiled. So when you are compiling, like more recent version, we can recompile only the changes compared to the version compiled on CI. So basically it turns every build that you run locally into an incremental build. You only have to compile the small set of changes that you have locally compared to the CI build that ran at some given point in time. As I mentioned, this is kind of experimental stuff, so even internally, not that many people use it, but probably we, at least internally we are going to adopt it more broadly and maybe even make this available externally at some point.
So we also have built a thing called IntelliJ Development Pulse. This is essentially a custom reporting system that shows some of the metrics for how IntelliJ is used internally. So it tracks, like, for example, this report shows the distribution of build versions among the team. So you can see how many people use nightly builds or EP builds or other builds. And we also track key metrics like how developers time can be wasted, such as indexing, compilation, like if first refresh. And we also track problems such as freezes or exceptions. We plan to include this report into Toolbox Enterprise. Right now, it’s not yet available there, it’s just something that exists as its own thing, but I just wanted to show it to indicate how we keep track of the developer experience when our colleagues are beating IntelliJ. So that was our local development story. Now let’s talk a bit about CI. So the CI server we use is TeamCity. So Space also includes CI functionality, but we don’t use it. We are actually very heavily invested into TeamCity, so our configuration for all the builds, all the products, all the branches, all the, everything takes about 90,000 lines of Kotlin just for the configuration. So as you can see, would be pretty hard for us to migrate to something else.
And we have roughly a thousand agents running builds and tests and everything mostly running on AWS. We used to have… When we had an office in St. Pittsburgh, we had a local, like a small local data center with agents. Now we migrated everything into the cloud when we had to close the office. So what does the CI build actually run? The CI build, of course run test. And most our tests are… This is one other thing that we are not doing, according to the industry best practices where we are doing our own thing. So most of our tests are functional, not unit. So basically we don’t use mock frameworks. We don’t use… We don’t write small isolated tests. We run tests that actually test entire features or entire scenarios of using features. What we use… variety test as it’s common for JetBrains we use everything 3G, 4G, 5G test, and G Cucumber. Not a lot of Cucumber, but some of it. And we are actually quite happy with using it.
And the big benefit of the way we write tests is that test do not depend or basically have very minimal dependency on how the feature is implemented. So literally we have accumulated tests over like 20 years of development. And 20-year-old tests are actually still valuable and still if they fail, they tell you something useful and you don’t need to spend effort on maintaining them or updating them to when the implementation changes.
The way we run test there is a build we call the aggregator. It’s basically a build running the entire test suite for all the IntelliJ products. So all in all it’s around 260,000 tests. Of course, we don’t run them in one chunk. We distribute them over roughly 200 builds running in parallel. And the entire aggregator run takes like an hour, give or take 10 minutes. And as this is like the fourth talk on this conference and the first two talks I was at… They all covered the problem of… Both of them covered the problem of flaky test, and yes, we also suffer from the problem flaky test. And yes, we also have like bots to notify people about flaky tests. We use TeamCity’s feature for tracking flaky tests, and we still haven’t yet gotten rid of those. So basically this shows some part, like a little part of the aggregator set up some of the builds. So basically there are categories of tests for different components of the product like JavaScript and I don’t know, Android plugin, what else is visible in the screenshot code with me.
And like these categories of tests are created manually. And then the tests in every category are distributed into buckets automatically. So you specify how many buckets you want, for example, JavaScript tests, and then they’re automatically split into these number of buckets. And all the buckets run in parallel. So if we don’t use feature branches, how do we actually manage running these tests before commit? So we use something called the Safe Push plugin. So basically it’s an IDE plugin to run test on a set of changes and merge them if the changes are successful. You don’t need to manage branches manually. Basically you just do your development in master. You’ll have one change or multiple changes related or unrelated, it doesn’t matter. Then you basically trigger the Safe Push plugin, send them off to CI, and if the CI build passes, you get a notification that your changes have been merged into master, and you can just basically continue working. So you don’t need any interruptions, you don’t need to worry about anything. If the test failed, then you get a notification that the test failed and then you can fix them and amend the commit so that you get a nice clean commit history and then retry and send the changes to CI again.
So direct pushes to master are blocked right now. So you have to either use the… You have to use either the test… on push which runs the full aggregator or for some changes where you’re completely sure that you’re not going to break anything. For example if you’re making changes to a README file, you can use compile and push which does a very minimal set of essentially compilation smoke tests and merges the changes after that, so it takes much faster. It takes like 10 minutes instead of like an hour or more than an hour. And one other related thing is called the Cherry-pick robot. So I talked a little bit about our branching policy, how we have the master and we have the stable branches and the release branches. And the Cherry-pick robot is how the changes usually get into the stable branches from master. So once the changes have been reviewed and tested by the QA in master we can actually start the cherry-pick process.
And basically what it does it also triggers the CI build to run the aggregator. And if the aggregator is successful it merges the changes to the stable branch or to the release branch. And the release branches are like very short-lived. So there is the… There’s usually no need to cherry-pick large set of changes there. It’s only critical fixes. And to make sure that the fixes do not break anything, we require approval from a tech lead and a QA engineer to cherry-pick a fix to a release branch. And these approvals are automatically verified that we have them. This is what the robot what this UI for the robot looks like. So there’s… In the Space code review there’s a button called TeamCity Cherry-pick Robot. You press it and you get this nice screen asking you the way you want to cherry-pick the changes and then it generates the commit message. It closes the review if the changes have been successfully merged.
So yeah basically nothing too fancy here. And finally how do we get to the release build? So if we are not using Maven or Gradle then what do we use? We actually have a separate bunch of code that produces all the release artifacts, the Windows installer, the dmg, the tar.zip and everything else from a tree of classifiers built by the Gps. So Gps basically produces a… For every just generates a tree of classifiers for every module and then this release build packages them into their correct artifacts, jars and everything like that.
At some point, previously we used Gant for that. Now we mostly replaced Gant and Groovy with Kotlin. So it’s just basically a Kotlin application that does the core generation, and you can easily run it locally. So if you want to test your changes to the installer you don’t need to wait for the CI or mess with the CI you just run it locally and you get the installer and you can make sure that it does what it… Make sure that it’s structurally correct and does what it needs, what you want it to do. So we are halfway through. The rest of the remaining of the parts are actually going to be shorter than that. So that’s great. Code review. How do we do code review? One other thing where we don’t follow best practices is that most code reviews that we do are post-commit or rather should I say post-merge. So we do not require someone to look at the code before it gets merged into master. We do this afterwards. The downsides are of course that sometimes people don’t do that. Sometimes people do not create reviews. Sometimes people create reviews and then the reviews get ignored.
But the upside is of course better velocity. So you never have to wait for someone to review your changes before you or your colleagues can build upon those changes. And in case something really terrible happens like in the worst case if the build is… If someone commits something terrible then we are going to discover this in the next nightly build and fix that. Or in the even worse scenario, if it’s not discovered in the nightly build then it’ll be discovered during the stabilization phase and fixed at that time. So for us this is actually the approach that works best. Cherry-picks to stable branches require to be… Must be reviewed before cherry-picks. So for the stable branches we have a higher quality bar because we actually, this is code that about… It is about to be released. So we actually want it to be working and decent quality. Previously we used Upsource which is also JetBrains’s product for code reviews. Now Upsource has been sunset. So we are using the code review functionality in Space. It has some nice features such as automatic reviewer suggestions.
And we have an IntelliJ plugin that allows us to do reviews inside the IDE. This is what the plugin looks like. Nothing… Well, also nothing too unexpected here. You get commits to review. You can write comments inside the IDE, you can respond to comments all the usual stuff. Issue tracking. For issue tracking we use YouTrack, and we have a public issue tracker.
Our user community has almost full access to all the issues that have been reported by other users and also by our internal QA engineers and developers for themselves. So of course some of the issues cannot be public. So issues related to like security issues, licensing issues, some of the issues just created internally by the team that have no direct relationship to the product itself. They are not public but 99% of all that is there you can see as users of our products. And of course the law is that if you have a public issue tracker then the number of open issues in the tracker will grow no matter what you do. So yeah we often get complaints that why some issue has been open for 12 years and it hasn’t been addressed because… Well, because it’s a public issue tracker and everyone can write an issue, and it does not mean that everyone is entitled to having JetBrains developers address their request. But yeah that’s a separate topic that I can be talking for a long time. To deal with YouTrack, we integrate with Zendesk.
All the workflows of our support team are centered around Zendesk. And we also create Zendesk tickets for incoming issues. And the support team looks at them and does the first level of triage. Is all the necessary information provided? Does the issue make sense at all? How well it’s aligned with our plans? Brief check of whether it makes sense at all for it to be implemented. Then the issues get assigned to developers and then scheduled within the team as needed.
YouTrack has a feature called Workflows, essentially it allows… Makes the issue tracker programmable, so it allows us to write small pieces of JavaScript that run inside the issue tracker when issues are created or modified. And this allows us to apply different automations. For example, if a user files an issue for the first time, we post a comment explaining that, explaining some pop parts of our issue management process. We can mark an issue as waiting for a reply, and then it will be automatically closed if there is no additional information from the user in the next two weeks. We can have conditions required fields, so some fields are required depending on the difference of issue status and so on. With many other issue trackers, people write bots for that. A lot of that can be done, for example, with GitHub bots. But with YouTrack, it’s actually very nice that it leads directly inside the issue tracker and there is no separate process that needs to be managed and it’s quite handy for us. We have also built a completely separate system for tracking the automatically generated error reports. Those automatically generated error reports include exceptions in an IDE, freezes cases when the UI is not responding, out of memory errors, and native crashes of the Java Virtual Machine.
And Exception Analyzer is responsible for receiving them from users, processing them, and allowing us to manage that. So it does ML-based automatic grouping and assignment. The main challenge here is actually when you have two different exception reports, you need to understand whether they’re related to the same problem or to different problems. And it’s not always easy because it’s not always clear which part of the stack trace actually identifies the place that did something wrong. For example, if an API method throws an exception, most likely it’s not the API method that is at fault. It’s the code that called it, did not use it correctly. We have put a lot of effort into correctly grouping the issues so that actually they are grouped based on the code that is at fault and not simply on the code that is on top of the stack trace. And in order to manage the issues and fix them, we also have an IDE plugin that shows the reports, and allows me to address them, and fix them, re-assign them, group them differently. It’s also like if the heuristics for how the issues have been grouped together have not been applied correctly, I can actually regroup the issues or I can merge multiple issues. This is something that normal issue trackers do not allow us to do. And that’s actually the main reason why we built a separate system.
The last part that I want to talk about is static code analysis. Our IDE includes a lot of features for static code analysis, and the main way we configure them is by using a shared inspection profile, so we check in the.idea direct in the version control because it contains all the model structure and we also… And the shared run configurations and the inspection profile is also one more thing that is part of this configuration shared between all the developers. And we also augment the standard set of inspections available in IntelliJ with custom inspection that we create for project specific code patterns. And the small number of them are written as plugins, but another significant part is using… Is using a feature called structural search and replace. Basically it’s structural search and… I’ll get to structural search and replace a bit later. Let me first talk about this part.
It’s also one part where we don’t really follow the established best practices. We do not have any linter rules for naming or formatting. One thing that I see is that people say, “Yes, we care about code quality, let us apply tools that allows us to ensure code quality.” But code quality is actually a very hard thing to measure exactly, and it’s very hard to automatically identify things that actually create problems at runtime or during development, so most people just focus on the easy part. It’s complete, it’s trivial to make sure that, for example, that imports are sorted correctly in a file. And so people write tools that no matter maybe your code may crash, your code may be really hard to understand, but the imports must be sorted correctly. And people focus on these trivial rules and actually block commits when those trivial rules are violated. And of course the consequences for violating those rules are usually very insignificant, but people say this is quality, we have to manage that, so let’s apply those tools and let’s enforce that. None of them ever report problems. So we try not to do any of that. We don’t have any inspections for naming or formatting. The inspections run locally in IntelliJ IDEA, nothing spares, so the shared inspection profile provides the settings for that. And we also have a TeamCity build for running inspections.
And yeah, so this actually shows what the structural search inspections look like. There is a large set of different types of rules, and for every rule you can specify a number of patterns that the IDE detects, for example, the methods used that should not be used. And you can also provide replacement patterns. So if someone uses the method incorrectly, the IDE automatically offers a quick fix for replacing the incorrect usage with a more recommended way to do the same thing. And this is actually a great way for us to ensure that the APIs are correctly used and if we update the APIs that this allows us to migrate the users to the new version automatically. The full inspection build on TeamCity actually reports a huge number of problems that we don’t care about all that much. And it’s actually more of a stress test of our inspection functionality than a useful report by itself. We have something called zero tolerance inspections. It’s actually the inspections for which we make sure we keep track of violations and make sure that all incoming violations are promptly fixed. The full inspection builds run the few… I don’t know, produces many thousands of errors.
And the zero tolerance inspection produces… In a normal case produces zero errors. And this is the report we get for that. So you can see there’s the pretty UI that shows all the problems that have been detected by this inspection run. At the moment where the screenshot was taken, we had 36 open issues, which is quite a manageable quantity. And yeah, we ran 214 different inspections. So let’s summarize a little bit. What products do we use for developing IntelliJ? First of all, as developers of IntelliJ, we rely a lot on the features of IntelliJ itself for providing shared configurations, so we used shared code style, shared inspection profile, shared run configurations. We also used shared indexes so that we can reduce the time spent on indexing. This is not a separate product, but still a very major part of the workflow. We use JetBrains Space on for Git hosting, code review, and hosting the package repository. We use TeamCity for test and release automation, we use YouTrack for issue tracking, and we use Toolbox Enterprise to manage the IDEs installed on developers’ machines and their plugins and settings.
And we have built a number of custom tools such as Gps caches, Safe Push plugin, Cherry-pick Robot and Exception Analyzer that automates some parts of the workflow that are specific to our environment. What of those can you apply? Of course if you want to try out Space that would be nice, but Space is actually targeted more at S&B customers, so not all of you would benefit from it. What you can apply, you can apply Toolbox Enterprise for managing your IDE installations. You can configure shared indexes to save time on indexing. And you can use structural search inspections to define project specific patterns that you want to avoid in your code and to provide automatic quick fixes for those patterns. That was a lot. I would be happy to go into details of anything I talked about during Q&A, or later during the event. I’m here until… I’m here today and tomorrow, and basically these are my contact details. Feel free to ask me about things. Thanks for the attention.
.image-darker {
filter: brightness(1000%) !important;
-webkit-filter: brightness(1000%) !important;
}