
Netflix shares observability metrics they captured to identify common problems on local and CI tool experience. They also share how remote test execution got PR build times down from 50 to 5 min.
Find out how Netflix’s DevProd organization concentrates on the local development loop and ways to shrink the time spent purely waiting. Points of discussion will include:
- Common problems with long local development loops
- Improving self serviceability and the build performance and consistency experience
- CI observability and insights using tools like Gradle Build Scan ™
- Pipeline acceleration using remote test execution with Gradle Enterprise Test Distribution
- Flaky test detection and other avoidable failures using test and failure analytics
Aubrey Chipman loves to work on developer tooling/developer experience. She loves being part of a team where they can grow, support, and elevate each other to help others. She has a passion for development work and the associated coaching, influencing, and generally making ecosystems better
Roberto Perez Alcolea is an experienced software engineer focused on microservices, cloud, developer productivity and continuous delivery. He’s a self-motivated, success-driven, and detail-oriented professional interested in solving unique and challenging problems.

Gradle Enterprise build and test acceleration technologies address the pain of unnecessary developer idle time waiting for builds and tests to complete. Build Scan gives you granular analytic information for every build, so you can quickly fix problems and debug performance issues. Test and Failure Analytics leverages historical data to proactively find unreliable builds and flaky tests, report on the people and environments affected by the problem, and guide teams to the root cause efficiently.
Interested in CI Observability and Build Optimization? Try these next steps:
- See how Netflix took a 62-minute Java build down to less than 5 minutes using Remote Test Execution with Gradle Enterprise Test Distribution
- See this short video about how Test and Failure Analytics can make your test sets more reliable and consistent
- Sign up for our free training class, Gradle Enterprise for Developers to learn how to debug build issues locally and in CI faster and more efficiently
Aubrey: Hello. Hello. Hello. Although. Hi. And welcome, everybody. So. Oh,
yeah. By the podium. Yep. Hopefully you can see all the things. So we're going
to be talking to you today about a more integrated build in CI to accelerate
builds at Netflix. So first of all, Rooz was a wonderful introduction for us.
We're both from the productivity engineering team like you was just talking
about run the JVM Ecosystem Team together. And I'm Aubrey Chipman. This is my
colleague, Roberto Perez Alcolea. So we wanted to give an overview. First of
all, the introduction we're going to talk about where we're coming from, what
we're typically doing over at Netflix. Go to some common problems on local and
CI experiences. Talk about enabling and managing constant change because it
keeps on going. We want to talk about improving the build performance and
consistency experience and improving self-serviceability. After that, we'll talk
about things that are on the horizon that we're getting into and want to have
more of. And then have a Q&A session. So. Well, let me go back over here. So,
first of all, we want to talk about just a baseline of how build and CI are
talking together. What do we mean by CI? In this case, the practice of
continuous integration. Just a reminder, just to set this baseline, there's
people who are committing changes. They're going to be pushing it over to a
repository of some sort. They want to see. Then, is it going to be building
successfully? Is it going to be testing successfully and then get that feedback
nice and quickly? So the way that varies is you're going to be doing this in a
more isolated kind of environment rather than your local build. Overall, Netflix
and the JVM landscape, we have 3.2 thousand active repositories, so we're not
going to be talking to you today very much about mono repo versus multi repo,
but we have chosen multi repo. So we do tons of binary integration as opposed to
getting in the code changes just in one spot and then merging it all together.
We also have a bunch of microservices with clients. We have hundreds of
thousands of engineers who are supporting this. We have about 191,000 JVM builds
per week. So there's a bunch of them. This is things that are happening locally,
things that are happening in CI and we publish about 63,000 artifacts. This is
just taking a look at the jars that we're producing, not things that are going
to be packaged up for later deployment necessarily, but just these jars
published per week. And so you can take a look at this picture over here, or you
might wonder, what is that funny, splotchy thing going on? So this is a picture
of a dependency graph. We have a few of them out there, a few similar kinds of
pictures. This one is from a few years ago, just taking a look at how the
various clients are all interacting together. So we've got really complicated
ones. One of our related teams was trying to figure out how to map it as it
looks today and then run into a kind of a buffer overflow problem with whatever
tool they were using. As well. When we take a look at the CI landscape, we have
35 Jenkins controllers, about 45,000 job definitions for these various
controllers. About 600,000 builds per week. A bunch of different agents that are
out there. This is managed with combination of by a central team and then by
individual teams that have very specific setup needs and about 1 to 100
executors per agent. So this brings us to.
Roberto: Common problems. So first of all, usually people go
and talk on Twitter or any other social platform that they are not Netflix. And
in reality, nobody is Netflix and we are not your company. So we have different,
different issues like we tried to tackle for the business and you might have the
same in your own company, but at the very end uncommon problems that we have
seen the local and CI tooling that talking to our engineers in different areas,
different organizations, different business units they suffer from same. So we
would like to chat a little bit about them. And after that we will talk about
the things that we have been doing the last few years to try to reduce the pain
in there, because the reality is that pain will always be there, like dependency
hell. So we have tried to reduce that and try to make it better for engineers
and make them more happy, joyful as Hans said in the previous talk. So the first
one is a slow feedback loop. We have been talking about feedback loop in the
last few minutes, one of the things that usually impacted is a slow test.
Dependency downloads. If I have a build, I need to download the whole internet
just to build my project. That's always painful, flaky tests. Is slowing down
people to get faster feedback or just things like compute resources. But if we
don't have on standardized ways to deliver computers to engineers? But if you
are using a PC with Windows versus a Linux versus OSX and you may have a modern
computer with different architecture that is faster than the others. So you have
different experiences for every single thing you need if you don't have some
sort of standardization. And test times are really important. We introduced
Gradle Enterprise a few years ago and what we found because we really weren't
measuring this, is that 80% of our build times is spent on tests. So it was the
low-hanging fruit that didn't turn out to be low-hanging is really, really a big
thing that we needed to address. And that's one of the things that we have been
working on in the last few years. Inconsistencies across environments. As I
mentioned, compute resources can be different and they are always different
between local and CI. But if you have something locally that is not available in
your CI agent like Jenkins or vice versa. What if you are building something
that requires some network access or security policies? Or what about Docker
like Docker store, it's really difficult these days where there is different
architectures in your machine building images for that architecture is sometimes
difficult for engineers, and understanding for the common engineer might not be
necessary. So we try to work in a way that we avoid the worst of my machine or
worse on CI only so people build confidence to build a product locally or in CI
and get the same results. And constant change. Typically, people talk about CI
as okay. A group of engineers is working on a project making sure that
continuous delivery something into the main branch. But in reality, as a
platform engineer, we also want to get them to the latest and greatest opinions
or frameworks that we provide to them so that for us, that's also part of the CI
thing. If I'm owning some sort of Java framework opinion for engineers, how can
I take them from version 1 to 2? How can I make sure that they can get to the
latest and greatest without so much hassle or without friction? And obviously,
security vulnerabilities are a huge topic these days. If there isn't a security
vulnerability, what can we do as platform engineers to make that change for them
without engineers having to just go and rebuild every single time manually?
Aubrey: All right. So just like that. Talking about enabling constant
change, one of the very first things that we do over at Netflix to help out with
this is we want to make sure that people are going to be using the latest
version of their Gradle wrapper. We have another item around it called Nebula,
and we want people to be on the latest version of that. We want people to be
locking their dependencies, have consistent and replicable builds. We want to
also make sure that people are going to be updating their build files in a nice,
manageable way. So they're using the latest versions of plugins are using the
latest DSLs, these kinds of items. So I talk about that because in the past
every particular project had their own Jenkins job to be able to do this. They
would have their own Jenkins Gradle wrapper update and dependency lock job
update. It looks kind of like this over here. Whenever you generated your
project with the project generator, it would create these for you. And we had
about 6.5 thousand Jenkins jobs with no centralized view. One of the issues that
we ran into here is that there would be a lot of skew if something needed to
change for all of them, then people needed to go modify either the XML that was
relayed over there or click through the UI and it was not streamlined and really
difficult to manage from a centralized perspective. So what we did from here is
we wanted to keep the same basic ideas to keep everyone up to date
automatically. But we introduced Rocket CI, so this is a custom Jenkins plugin
and Bitbucket plugin. It's currently internal. It combines a suite of tools,
help out with continuous integration. So every JVM project that's newly
initialized is going to come and automatically be enrolled for Rocket CI. You
can see up there on the Rocket features that we've got a few different
enrollments that are available. So there's things like keeping your Nebula
wrapper, Gradle wrapper up to date, keeping your dependency locks up to date,
and making sure that your build hygiene, your DSLs, kinds of things are getting
up to date as well. These will run nightly for everybody and it has aspects of
configuration as code in there as well, so that if people want to make
adjustments, it's centralized with their own repository and we can submit a big
batch pull request as opposed to modifying things in the Jenkins UI itself. So
the way this works is that Rocket CI is going to send updates via pull request.
The very first step is it's going to go ahead, grab the source code, repository,
make a fork, and then try to run the change by itself. If everything doesn't
finish at that point, we know there's some sort of infrastructure failure. Maybe
a container failed for some reason. Maybe something ran out of memory, maybe
your project just couldn't configure. It was in a red state to begin with. And
it's got some problems right there. So alot of these will self-resolve in the
next day or so whenever it runs again. But a number of times it won't. So we
send people notifications saying, please go take a look at this because we
currently can't even send you a pull request. The build is not in a good enough
state to get there. In the good case though, if everything is successful, we
have run all of the updates on the branch, on the fork. Then we can open up a
pull request to the repository and then auto merge things in if everything looks
good. This is an example of the pull request where we can modify to have non
default things that talk about like we have updated your dependencies. This is
how you can understand what your dependency diff is. Here's why different things
were updated in this particular way, and it really helps for people to
understand why their pull request is what it is, when it has this additional
information and additional tools inside of there. As well with Rocket CI as a
platform team, we have much more visibility into how this is going. We can see
the number of projects that are enrolled for each of these different
enrollments. You can see the different lines on this chart over here. We can see
how many enrollments were successful the past day, the past X number of days. We
can see how many of them failed, how many are in an odd state that need to go be
manually investigated. And there's just a lot of centralized information that we
can see and we can figure out do we need to make changes in our process to help
streamline this for everyone else?
Roberto: But not everything is a happy path, right? One of the things
that we have been suffering or we have failed, honestly, is how can we validate
a change before opening up a pull request. So years ago, we started working on
this project called Niagara. And Niagara basically allows you to go and say,
hey, I want to clone all these repositories based on some information in our
case, build matrix, and then I want to run a particular script. It could be a
bash script, it could be anything. And this bash script usually is like, Oh, I
want to run a full Gradle build. And what Niagara does is it talks to titles,
which is our orchestration engine for containers on top of Kubernetes. So it
goes and say, oh, you know what, I'm just going to create thousands of
containers. Each one of them will go on a different repo and run your bash
script, and then give you back the results. So this is like a noble idea, really
nice. But the reality is, when you follow this pattern, it's really difficult to
validate changes because sometimes a given build requires network access,
security policies or databases. We really don't know how developers approach the
way they tested applications. So we found that testing in this layer, it's
practically impossible, at least at this point. So we only can do like a
specific checks, like can I compile the code? And that's good enough for some
sort of information that we can open a pull request and then see what happens
with the pull request level. In reality, what we want to do in the future is
okay, how can we make sure that if we clone all these repos, can we really run
all the tests? Can we operate a library, are running the tests and then if
everything looks great, then just open up pull request because the last thing we
want to do for customers is open a broken pull request. They will be like, Okay,
why are you opening this thing that is broken? Like, it's noisy and I don't
trust your tooling. It's really difficult in life when you lose confidence in
someone or something to get it back right? So we can have a lot of winnings and
then make a mistake with a change and people will unenroll from this and
probably we will never get them back. So we need to spend more time on this. And
it was interesting for us to share that even when you tried to clone multiple
repos, there might be interesting things in your company that would prevent you
to just run a full build. So that leads us to other things, which is how do we
improve the performance and consistency of experience across local and CI, which
is the most important thing on this talk, I believe. So one of the things that
we found over the years, is people tend to use CI agents their own way. They
might decide to say, you know, every single time I run a build, I just want to
clean up my whole workspace. I want to use a new Gradle home, things like that.
I'm using Gradle because we are very into using Gradle. With this we'll apply
definitely with our build tools like you might have dependency caching, binary
integration is hard, honestly. So what we have found is, okay, most of times
people decide to just clean their plugin because they don't trust in the build
to some capacity. And that means we are going to download again every single
thing that you need to build a project. And when you think about like a modern
application using Java framework, like a spring boot, micronaut, you name it,
you're kind of downloading a huge chunk of the internet just to do some sort of
work. So we decided to start distributing a common use dependency cache across
all the CI agents. What that means is that internally we have wrapper on top of
a spring boot that basically publishes a bomb, that contains all the
dependencies that the developers should be using in order to build applications.
And what we do is we analyze that bomb. We also look at all the downloaded
dependencies that people get from Maven Central and get the most popular ones,
and then create a read-only cache that we ship to every single CI agent. So and
also Docker images. So for the process that I'll be mentioning around opening
pull request, we also have the destroyed cache. So what happens is when you have
a new project that doesn't have any cache. We have seen people that takes three
or 4 minutes to download dependencies. It's probably 400, 500 megabytes. You can
see that it's hundreds of files that you need to download when you have
something that is shared across multiple agents and is also consistent because
you know that all your team should be building against a specific version of a
platform. Then we were able to reduce on CI the downloading to just a few
seconds. So we gave back engineers 3 minutes when they had like a brand new
build or a brand new Jenkins job. So when they decide to just wipe out the whole
workspace.
Aubrey: Thank you. Yeah. So that's talking about the most common
artifacts. But what about artifacts that are brand new, artifacts that only a
few projects need, artifacts that are just more rare in the area? We're going to
talk about a different kind of artifact caching right now. So we use this tool
called Varnish, which is really wonderful, to help us lighten the load on our
artifact storage. Another one that's really big for us is it helps cache 404s.
We have a number of virtual repositories under the hood for when you're
requesting a particular artifact. And as you're looking for artifacts, if you
say this version should exist, go check all of these different repositories.
We're able to use Varnish to say like, Hey, we didn't find it. It's still in the
time to live for this particular request, so don't go looking anymore. You don't
need to make various different metadata requests or artifact requests to
everything else because we know about this. So we're able to use Varnish Cache
to be able to request all of the artifacts that are used. We use as a very fast
dependency cache, and we're also using it as a build task output cache. So what
this is, is for the fingerprinting of your particular build task. Let's say
you're running compile Java and or you're running generate some sort of code
when you have your task, there's various inputs that you can define for it, such
as these are the files that you're going to look at, these are the properties,
files, these are environment variables, whatever it is. And each of these you're
going to make a hash that's going to be associated with those items, those
attributes. As long as you are having a hit of this fingerprint, then you're
able to say, hey, I ran this compile Java task before I have all the exact same
inputs, so give me the result there so I don't need to do it again myself. This
is a really great way to save work. So you're not just redoing the same sort of
things over and over, and especially if you have tasks that are very intensive,
you can save tons of time by being able to do this. We did this with Varnish
Cache because we had this set up prior to running Gradle Enterprise. Gradle
Enterprise also does this, but we have it with Varnish. So a couple of the
challenges that we ran into when we were doing this is the first one was cross
region replication. We have a number of builds that are running in a particular
region, but we have builds that are running in other regions or other ones even
further away. So if someone requests an artifact, we want to be able to have it
equally accessible from wherever it is you're going to be running this build.
Similarly, we had challenges with cache eviction, so whenever something has
entered the cache, it is now everywhere. And if for some reason we want it to
not be everywhere. So for instance, we've had some artifacts published that may
have had a really bad performance problem. It was bad enough that we said that,
yeah, it's going to impact everyone if we just remove this from artifact
storage. But it's worthwhile because we really don't want anyone to use it at
all. It's quite bad. So we'll go ahead, remove it from artifact storage,
Artifactory and then we want to make sure that it's also not going to be served
from the cache itself at this point. Varnish comes with a really wonderful
feature called Broadcasting, where we can say, hey, we're going to be purging
this and send this to all the instances across all the regions all at once. We
just have one request and then it goes and removes everything right away.
Similarly, we've also run into the situation where a particular task or plugin
didn't necessarily have all the task inputs configured correctly right out of
the box. So sometimes people would run a build. They would see that, hey, we
used this task cached output, but it's not correct. So I was running on a
different flavor of machine. And so it's no longer applicable, right here is one
of the areas where we've seen it where something was like, oh, Mac specific
versus Linux specific. So we wanted to have a good way to evict many
build-specific cache keys. Currently, the way we do it is we have to find each
cache key and enter it in as a request to go ahead evict from there. So that's
definitely one of the things that we're working on to make that a little bit
more streamlined. Oh, goodness. I hope everything's all right there.
Roberto: Yeah. Yeah.
Aubrey: I'll wait for a second till some of these things get quiet once
more.
Roberto: Write about them or something happens anyway.
Aubrey: There we go. All right. Well, I hope everything is all right on
those alerts, but we're going to continue. So taking a look at the artifact
cache effectiveness, this is one of the things that we're really excited about.
We're able to see that most of the time we have about a 70% cache hit. You can
see this going up and down over time. And then you might notice this thing right
in the center where there's a bunch of cache hits. So this is related to one of
the things we were talking about earlier where between about 2 a.m. to 6 a.m.,
we do tons of pull requests to different builds. So it's running the same kinds
of things over and over. We're not necessarily going to be changing
dependencies, some of them do, but we are going to be resolving a bunch of
builds, a bunch of dependencies, and so you'll see that there's a lot more cache
effectiveness during that particular time. This brings us to remote test
execution.
Roberto: So by now you probably have to sense the need for speeding up
things, especially builds. And you might wonder like, okay, how did you survive
with this in the last few years until now? So the next thing we are looking into
or we are already working on is remote test execution. This is something that we
use with Gradle and Gradle Enterprise, but it's something that people can apply
in different platforms for sure. People are already doing it with other build
tools too. Basically the concept is to take any local CI build and instead of
running the tests within the machine that is executing the build, ship that work
to remote workers. This way you can have better prioritization, reduce the usage
of compute resources locally, and also get like a better experience across local
development and CI. We don't want to get into more details on this. I'm going to
be speaking with Marc Philipps on how they build the Test Distribution in Gradle
and the learnings we have had with this approach at Netflix at 3 p.m. in this
room. So if you're interested, definitely come in. But it's remarkable to call
out these. When we started looking into this particular feature, we were working
with teams that support one team call Open Connect. If you're not familiar with
Open Connect. Open Connect is the CDN at Netflix that basically every time you
go and watch a movie instead of a streaming that from the cloud, we have really
a box close to your home with an ISP and you get the movie from them. So at this
point, you can imagine they're highly important to us. So this particular build
used to take 15 minutes prior to Test Distribution, once we do this Test
Distribution and more parallelization better compute usuage and also the
consistency that we have mentioned. We took down to almost 6 minutes. So this is
more than a 50% winning, and people are loving it, in the sense that when we
have an issue, outage, or something, because we are still learning from the
tool, they come to us and tell us, hey, don't take away the nice things from us.
Please fix it rather than, oh this doesn't work. Okay. So one very important
part is we have to spend time on not only improving the build performance, but
also making sure that if you are a engineer or support engineer or just as a
customer, you should be able to see what happened and why. Obviously, we enhance
the build insight not only by using Gradle Enterprise, but also exporting
information in a way that could be more digestible for people. So for example,
if you're on a Jenkins job, things like simple things like just sharing a link
is always helpful for people. Like they don't have to go and crawl all the logs
and try to find where it happened. They can just go on click a Build Scan. This
is the small thing that might take a few minutes, but it's really gonna help it
to save tons of time. Asking an engineer. It's not for me to a build tool run a
particular build configuration that somebody else configured for their team to
want to start looking at the logs and try to make some sense of it. So if you
kind of spend time on trying to surface as much as possible in a more friendly
way, it always paid off. In addition, well, we have Gradle Enterprise. We're
able to filter by many facts, many custom things that we create. And we were
able to export this data to create a proper dashboard for our team to understand
it across like Nebula Gradle versions or just how things are getting built,
local versus CI or things like, okay, who is using IntelliJ, what versions that
they're using? Can we roll out new plugins, things like that. So really having
this visibility as a platform team has been very important to us. In order to
take decisions on what to do next, can we introduce making changes? Should we do
it? Probably we shouldn't. But having this data is always helpful for us.
Aubrey: All right. So another thing that we want to be taking a look at
is flaky tests. So, first of all, what are these flaky tests? Here's a great
example where you can see that something was succeeding some of the time, but
also failing some of the time. And this has to do when there are no code changes
that have been made. Typically, there is some sort of infrastructure problem.
Maybe you're talking to a database, but the data has changed. Maybe you're
reaching out across a network. Network connectivity drops for some reason.
There's a number of reasons that could cause a flaky test, but overall, this is
kind of what they all look like. Here's your test report view. So we wanted to
be able to see how often is this happening as you're taking a look at these
images? I think it's 15% of our builds that were running this particular week,
had some sort of failing test in them of all these builds as well. 1% of them
had a flaky test someplace in there. So these are things which traditionally
would have failed someone's build either locally or in CI. But overall, it
doesn't necessarily mean that the test failed because it's flaky. It's giving
kind of a weird signal over here. So we want to save people time by defaulting
to running these tests three different times. And if by the end it has still
failed, well you have a failed test? But if it has succeeded by at least the
third time, then you have a flaky test. We're able to see individual breakdowns
with the Gradle Enterprise dashboard. And so you can see over the top image.
Some things were going pretty wrong for a while. Early in the process. There's a
lot of flakiness. Some of the builds actually went red. They didn't succeed at
all after the three tries, but later in the week things resolved themselves. So
there was probably some sort of network infrastructure issue and this could be
fixed in the future if the team will go take a look at it in the second project
on there. These are real projects that we have. You can see that there's still
some test flakiness that goes across the entire duration of things that we're
seeing there. So there's probably some sort of issue that's still going on and
perhaps something with timing in the test setup. So ask that we have to our
teams is while we make this easier that you don't need to go investigate a test
that will succeed on a rerun, we're saving you time by just marking this as
flaky. So please just go ahead. Take a look at this. Don't just leave them flaky
forever because it's not useful for the team themselves. Even if we're helping
them out by not having to go investigate it. Kind of not real red test. All
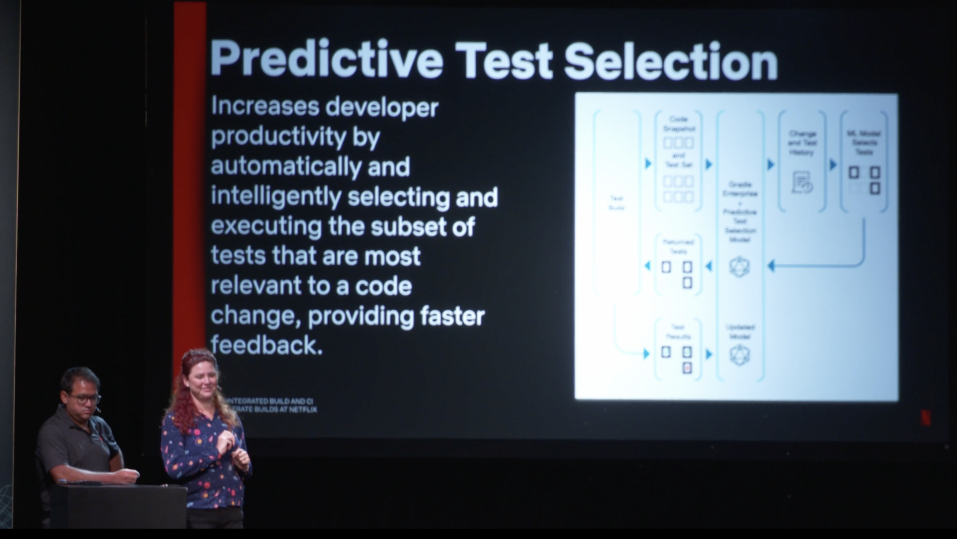
right. Time for us to take a look at what's on the horizon. So one of the things
that we're super excited about is predictive test selection. This is a new item
from Gradle and we are rolling it out. Right now, we're in the early phases of
friends and family and then are taking a look at rolling it out even further. So
what is this? We're going to be hearing a lot more about it from Eric and Luke.
I think tomorrow. They have a talk, I think, at 3:00. Don't don't hold me to
that one. But a predictive test election overall, it helps increase developer
productivity by going ahead and figuring out what are the best tests that can be
run for this particular code change. It's going to be taking a look at what are
tests that have failed in the past, rerun these, what are tests that are related
to this particular code change that you have made, run these right here. The
predictive model is really going to help figure out what are the best changes,
what are the best tests to run for these particular changes. And it seems to
have a very powerful outcome on time savings. So when do we use it? Right now.
Currently, we have this configured to run on local builds that are not executing
a publishing task on CI builds that are pull requests, and in CI where the
branch is not the default main branch, and it's not a release branch. So the
reason we chose these is we wanted to have areas where people are going to be
feeling this pain of I have long tests the most, so if I'm running things
locally then I want the feedback to be as fast as humanly possible. I really
want to only run the things that are related to my particular code changes and
let me know if things look good. Similarly, if it's a pull request, I'm probably
iterating on something. I'm waiting to make sure that it goes green before I can
merge it in there. We want to just make sure we're providing great feedback as
fast as we can. And so far the simulations are very promising. This is one of
the really wonderful things that I love here, is we have only rolled this out in
reality to just a few different projects of friends and family, but we're able
to see across all of our builds what does this look like if we were to turn it
on tomorrow? With this, we're able to really see the dramatic savings that can
be found. Once we fully roll out this particular feature, we're able to go to
teams and say, like, hey, this is upcoming. We're very excited for it and you're
going to be saving tons of time. Here's an example of one project with
predictive test selection. So you can see these are the things that are selected
versus not selected. And it kind of varies over time as whatever code change was
put in there. And this brings us over to another item about testing.
Roberto: Yeah. So one of the pain points we have seen at Netflix is
integration testing. People need to write this against databases. Let's say you
have a Postgres database, Cassandra database, you name it. They have spent time
doing like embedded databases. Sometimes they use Docker, compose, sometimes if
they are mature enough, they go on to use something like test containers. The
reality is the experience, as we mentioned before, is different from local and
CI. If you're an M1, OSX, Apple M1, Docker is different from what you might get
in Jenkins. Similarly, we have seen issues where IPV6 support is not the same.
The CI team doesn't really own the experience around Docker. They provide Docker
for you, but you are up to like a spin up a container. Clean it all. Thankfully,
things like Testcontainers do that cleanup for you, but if you are using Docker
compose, well good luck with that. You need to make sure that you shut down
these services. Otherwise, you're just going to kill the agent and be about
tenant and be a bad neighbor to other projects if you are sharing that with
them. Plus, running Docker on CI on a local requires memory of this usage and as
I said, remove the need in our case from Test Distribution to run agents that
require Docker. So we are looking into test containers cloud, which is a better
project from Atomic Jar if you're not familiar with those containers. Those
containers is a library java multiple languages allows you to do spin up
containers programmatically you shut them down and then right integration test
the proper way I would call. So the thing with this containers cloud is allow
you to spin off all these things in the cloud remotely on things that they
manage. So we don't need to really care about operating Docker at the scale
operating Docker for local or CI, you can be the same experience for engineers,
so we're really looking forward to see where are the learnings here.
Aubrey: Another area that we're taking a look at is IDE enhancements. So
a few of the things that we are very excited to investigate and proceed forward
with are things like shared indexes for internal projects. Right now, there are
shared indexes for IntelliJ, for example, that are available for things in Maven
Central, but for our internal repositories. As you may recall, we publish a
bunch of artifacts. We also want to have the similar kind of shared indexes. So
this is something that we haven't rolled out, we haven't started working on yet,
but we are looking forward to doing. Another item is about helping to manage the
IDE versions in use. Another one of the slides that Roberta was showing earlier
was the skew of IDE versions, specifically of IntelliJ IDEA, and there is a lot
of them on there, and all of them are various years. We'd really like for people
to be able to be using just this year, or this year and last year, and help
folks upgrade this as well as their code bases. So one of the tools that we've
talked about is Jet Brains Toolbox Enterprise. They have the ability to help
manage IDE versions, help manage plugin versions. And we're taking a look at
getting this all set up so things are easier for local developing processes.
Another one is we have a bunch of teams well, we have a few centralized teams
that are rolling out IDE based plugins to help with either code migrations or
just help with their particular workflows. And we want to make sure that as this
becomes more popular, that we're able to have these teams test against the
latest IDE versions. Currently, you have to specify what IDE version you want to
test against. When a new version comes out, then you have to update your build
and make sure you're still testing against that one there, and there should be
some of our shared infrastructure. So we have some key takeaways for you. Want
to make sure that as you're running your builds for local and CI, you're
avoiding work at every level, wherever possible. You want to be avoiding these
things. This can be helped with read-only dependency caches, can be helped with
task caches so you don't do the same work over again. You want to be
streamlining your work. In our case, we do it with Test Distribution and Test
Selection. So these are very wonderful things. Help everything go nice and easy
and there's really just always low hanging fruit. Whatever it looks like at your
particular company, it could look like these, it could look like other items,
but there's things to address. And that the local and CI experience should be
consistent, makes for more understandability, better reproducibility. It's a
good way to do it. So please also come see us at these other talks as well.
Roberto and Marc Phillips are going to be talking about how we built a
distributed testing platform at 3:00 right in here. And then later today at
4:00, I'll be part of the live DPE showdown with some other fabulous people
right up here on stage. So thank you very much. Hope you have enjoyed.