This year’s sessions
Watch recordings from our 2025 Summit speakers, organized by topic and company.
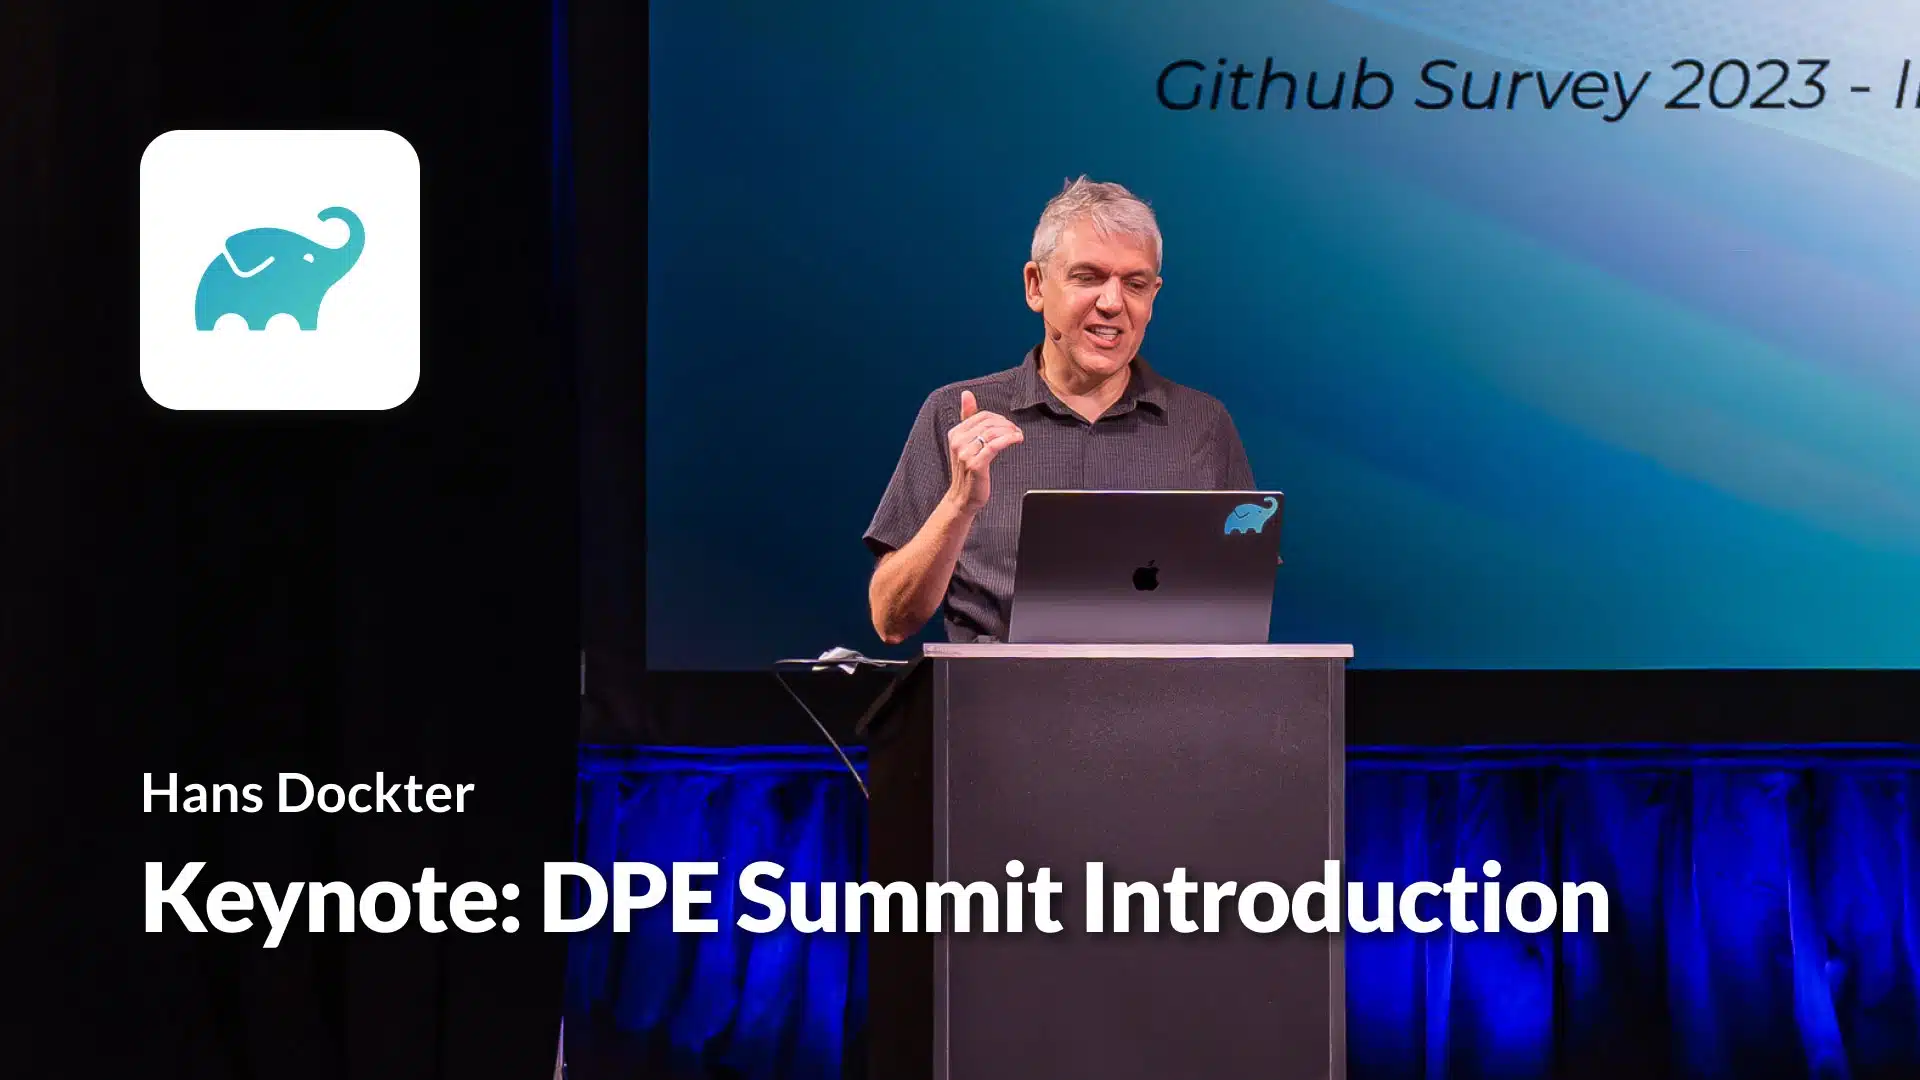
You can write code faster. Can you deliver it faster?
Generative AI is redefining how code gets written—faster, more frequently, and at greater scale. But your delivery pipeline wasn’t built for this. The more code GenAI produces upstream, the more pressure it puts on downstream systems: build, test, compliance, and deployment all become bottlenecks. Without significant change, GenAI won’t accelerate delivery—it’ll break it. This talk explores how GenAI is increasing code volume, reducing comprehension, and encouraging large, high-risk batches that overwhelm even mature CI/CD systems. The result? Slower feedback loops, more failures, and mounting friction between experimentation and enterprise delivery. To break this cycle, pipelines must significantly improve their performance, troubleshooting efficiency, and developer experience. A “GenAI-ready” pipeline must handle significantly more throughput without compromising quality or incurring unsustainable cost. This isn’t just a matter of scaling infrastructure. It demands smarter pipelines, with improved failure troubleshooting, intelligent parallelization, predictive test orchestration, universal caching, and policy automation working in concert to eliminate wasted cycles, both in terms of compute power and developer productivity. Crucially, these capabilities must shift left into developers’ local environments where observability, fast feedback, and root-cause insights can stop incorrect, insecure, and unverified code before CI even begins. The future of delivery isn’t just faster. It’s smarter, leaner, and built to scale with GenAI.
Watch the video 
Beyond the Commit: A Fireside Chat on AI and Developer Productivity
Join Brian Houck (Microsoft) and Nachiappan Nagappan (Meta)—two of the most influential voices in Developer Productivity—for a rare and insightful fireside chat. Drawing on decades of research and industry experience, Brian and Nachi will explore the evolving landscape of Developer Productivity metrics, the transformative role of AI across the entire software development lifecycle (far beyond code generation), and where they would invest—with no budget constraints—to drive the next wave of innovation in Developer Productivity Engineering in the era of generative AI.
Watch the video
Measuring the Impact of AI on Developer Productivity at Meta
With AI adoption at the forefront of developer productivity investments across the industry, the question of how to measure ROI is dominating discourse. At Meta, we’ve established a comprehensive suite of metrics that measures the impact of AI on developer productivity. In this session, we’ll describe the extensive telemetry we have created to support this, explain how to handle complex source control operations, and share directional correlations with more classic developer productivity metrics. By the end of this talk, you will understand how Meta has approached AI driven developer productivity all the way from adoption to the value it adds to our business.
Watch the video
What Makes a Great Developer Experience?
Having a great developer experience boils down to three key points: speeding up iteration cycles, improving developer focus time, and reducing cognitive load. But what does that really mean, practically, in an actual business? What do you really _do_ to accomplish those things? And how do you overcome all the technical and human barriers to solve it? I can’t tell you all the answers in 30 minutes, but I think you’ll be surprised at how much we _can_ cover about the most important pieces, in that time frame.
Watch the video
Developer Productivity in the Age of GenAI
Talk details coming soon!
Watch the video
Optimizing for Time: Dark Matter
Much of the work in the productivity space is focused on build speed or tooling improvements. Although beneficial, there is a larger opportunity available: Non-coding time. Standup updates, XFN alignment, chat, email, task management. All of these constitute the “Dark Matter” overhead that engineers have to deal with on a daily basis. We’ll dive into how Meta measures time, many of Meta’s top-line velocity metrics, and even some insights you can implement today, in order to help your engineers be more productive.
Watch the video
Measure, Don’t Guess: Observability as the Key to Performance Tuning Software Delivery
The golden rule of application performance tuning: measure, don’t guess. Yet when it comes to developer productivity, too many teams still guess. Builds are slow, tests are flaky, CI feels overloaded—and the default response is to throw hardware at the problem or hope it goes away. In this talk, we’ll apply the performance engineering mindset to developer experience, showing how observability data from Develocity can profile builds and tests just like applications. By measuring and optimizing build and test performance, teams directly improve the DORA metrics that matter: shorter lead time for changes, lower change failure rates, faster recovery, and higher deployment frequency. Developer productivity is a performance problem. If you want faster delivery and happier developers, the path is the same as for applications in production: measure first, then optimize.
Watch the video
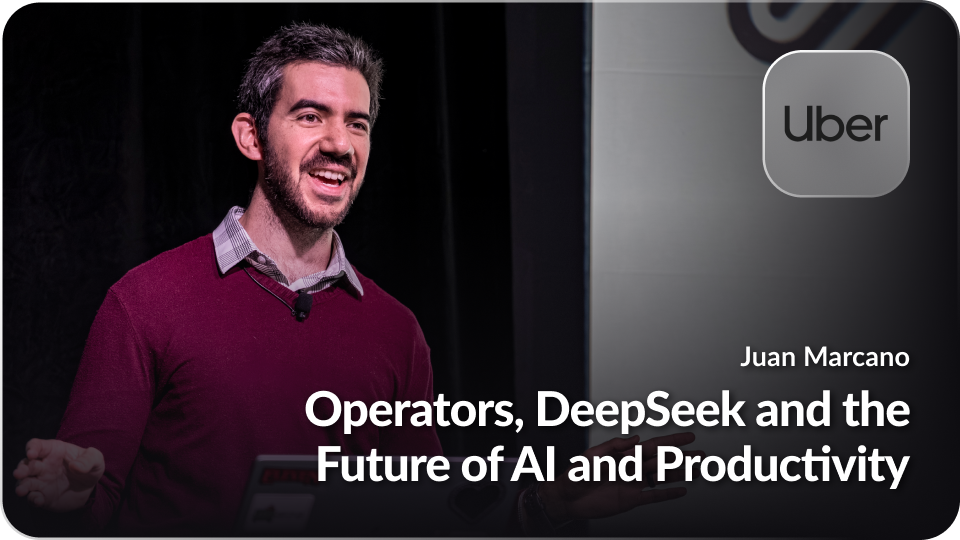
Operators, DeepSeek and the Future of AI and Productivity
Traditional script-based testing, like those using Appium, often struggles with frequent UI changes, causing tests to break and requiring engineers to spend 30-40% of their time fixing them rather than developing features. At Uber’s scale—operating in thousands of cities, supporting 55 languages, and running countless experiments—manual testing is infeasible. These limitations make automated testing a necessity, but legacy methods are too brittle to handle the dynamic nature of modern apps. DragonCrawl addresses this challenge by leveraging generative AI to create tests that adapt to UI changes rather than breaking. Once trained, it can be deployed across all Uber applications without frequent retraining, significantly reducing maintenance overhead. Despite its capabilities, DragonCrawl is highly efficient, requiring only a fraction of the computational resources of large models like ChatGPT, making it cost-effective to run at scale. It works by extracting view hierarchies, determining possible actions, and selecting the best one while dynamically adapting to unexpected pop-ups or variations in UI. By separating execution and validation, it ensures reliable results while minimizing test fragility. AI-powered assertions further enhance test reliability, moving beyond brittle text or ID checks. Instead, testers can ask high-level questions like “Is there an ad on this screen?” or “Is alcohol visible?” using a generalized visual question-answering (VQA) framework. DragonCrawl’s impact is already significant, catching over 30 critical bugs (each potentially saving Uber millions), resolving 100+ localization issues, and even aiding in language rollouts like Pashto and Dari for Afghan refugees. Additionally, OmegaCrawl is transforming Uber’s internal workflows by automating repetitive operational tasks for developers, reducing inefficiencies. More broadly, the evolution of AI in testing and development reflects a larger trend in AI research—balancing supervised learning (SL) and reinforcement learning (RL). Early AI models relied heavily on SL, which became too rigid, leading to the rise of RL for adaptability. However, RL alone often results in AI exploiting reward functions, requiring human intervention. The field is now shifting toward a hybrid approach, using SL for structure, RL for adaptability, and operator-driven AI for real-world grounding. The future of AI in software testing and beyond lies in this balance, where models can learn, adapt, and execute tasks while staying aligned with real-world constraints.
Watch the video

The Critical Role of Troubleshooting in an ML-based development process
This talk explores the critical role of troubleshooting in modern, ML-driven software development. We first look into traditional DORA metrics and their valuable insights. Nevertheless, their inherent lag and delayed feedback loops present challenges for effective optimization. The presentation introduces “Local DORA” metrics—such as Time To Restore (TTR) a local or a Pull Request failing build— as more actionable proxies that provide immediate feedback, enabling organizations to react swiftly to issues. In particular, optimizing local TTR is paramount for accelerating development speed. The talk will then address the dual impact of AI/ML on troubleshooting: while ML-generated code can complicate debugging issues, AI tools, such as those in Develocity, can significantly enhance troubleshooting capabilities, shorten feedback loops, and therefore improve development efficiency.
Watch the video
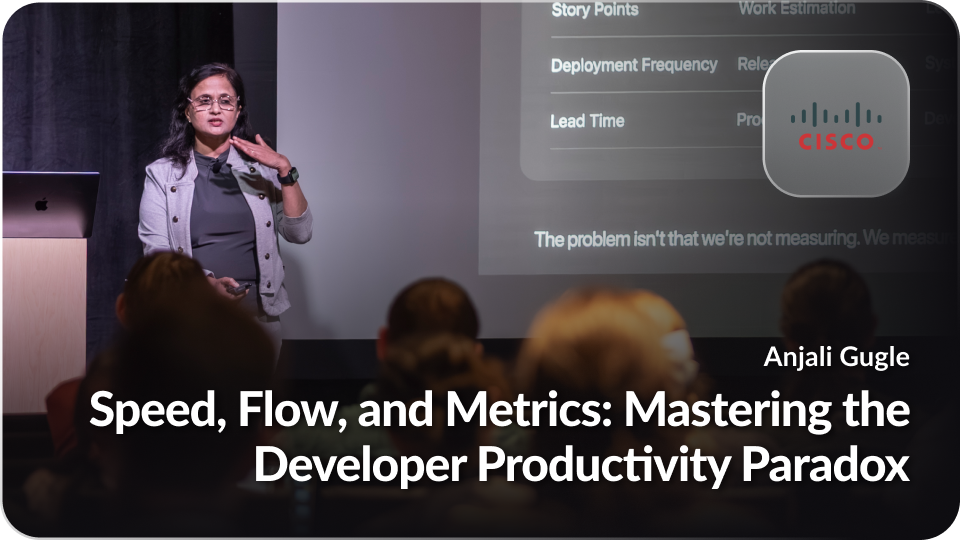
Speed, Flow, and Metrics: Mastering the Developer Productivity Paradox
In the race to accelerate software delivery, organizations often focus heavily on metrics, dashboards, and automation. But are we measuring the right things? Are we truly optimizing for meaningful productivity, or simply encouraging activity? Developer experience (DX) goes beyond just delivering software faster—it’s about reducing friction, ensuring quality, and creating an environment where developers can innovate with confidence. This session will examine the hidden trade-offs in developer productivity and introduce practical strategies for optimizing workflows. We’ll explore methods to measure and reduce bottlenecks such as approval times, review cycles, and resource utilization, all while maintaining high-quality standards. Additionally, we’ll discuss how AI-powered tools can transform productivity by simplifying documentation, elevating architecture, and accelerating software quality through gating and synthetic testing. A key focus will be Productivity Metrics and Measurement—how organizations can assess and optimize developer satisfaction, rather than just tracking activity. We will share insights on how measuring developer satisfaction directly correlates with improved productivity and business outcomes, helping create a developer-first culture. Through a real-world case study, we’ll highlight how adopting advanced productivity strategies and AI-driven workflows helped a large organization reduce friction, accelerate delivery, and improve developer satisfaction. Join us as we explore how to build a developer-first culture, where developers can work faster, smarter, and more joyfully—ultimately driving both innovation and business success.
Watch the video
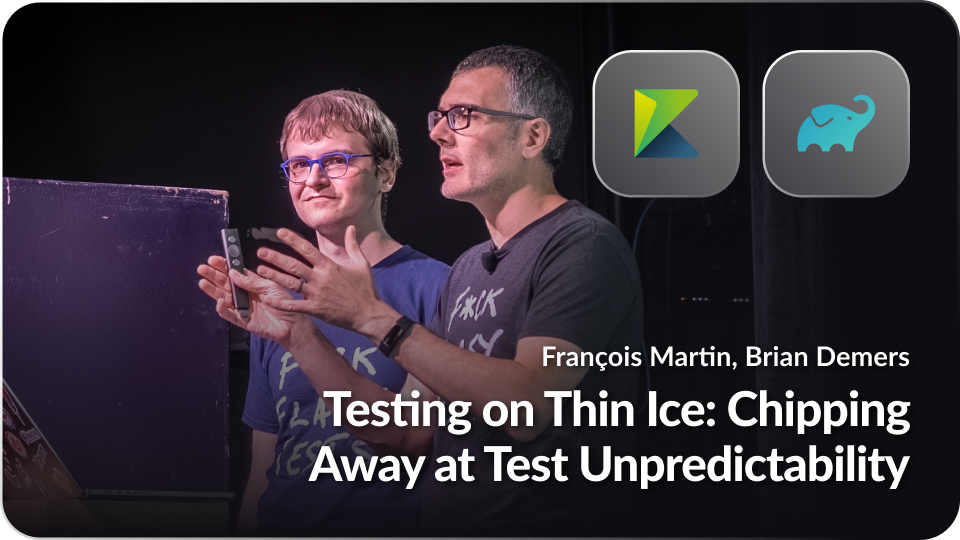
Testing on Thin Ice: Chipping Away at Test Unpredictability
Ever tried to catch melting snowflakes? That’s the challenge of dealing with flaky tests – those annoying, unpredictable tests that fail randomly and pass when rerun. In this talk, we’ll slide down the slippery slope of why flaky tests are more than just a nuisance. They’re time-sinks, morale crushers, and silent code quality killers. We’ll skate across real-life scenarios to understand how flaky tests can freeze your development in its tracks, and why sweeping them under the rug is like ignoring a crack in the ice. From delayed releases to lurking bugs, the stakes are high, and the costs are real. But don’t pack your parkas just yet! We’re here to share expert strategies and insights on how to identify, analyze, and ultimately melt away these flaky tests. Through our combined experience, we’ll provide actionable techniques and tools to make sure snow is the only flakiness you experience, ensuring a smoother, more reliable journey in software development.
Watch the video
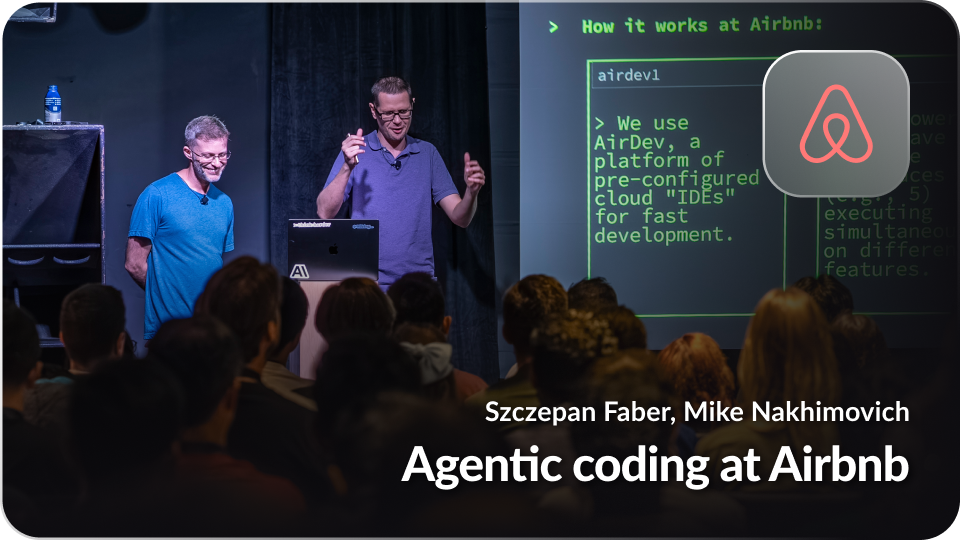
Agentic coding at Airbnb
It’s amazing how we can now build working apps just by few-shot prompting LLMs. But try doing this with monorepos of 10s of MLOC, like the ones used for planet-scale apps that must be secure and compliant. Responsible agentic coding at scale, where 1000s of engineers materialize code changes by engaging in deep sessions with AI is really challenging. We want to share Airbnb’s journey, the trade-offs we picked, learnings, outcomes and productivity impact we observed.
Watch the video

JetBrains DevEco Survey: What Thousands of Developers Tell Us About Productivity in Their Companies
What happens when you ask several thousands developers and their managers around the world how they experience productivity and what developer experience really means to them? At JetBrains, we set out to find answers, not just about tools and metrics, but about the human side of developer productivity and experience. In this talk, we’ll share key insights from our Developer Ecosystem Survey, which now includes a dedicated section on DevEx and DP. You’ll hear what developers and managers are really saying about the way companies are currently approaching DevEx and productivity: what helps, what hinders, and what they wish companies did differently. With a mix of research insights and practical takeaways, this talk is for anyone working to improve developer experience and productivity.
Watch the video
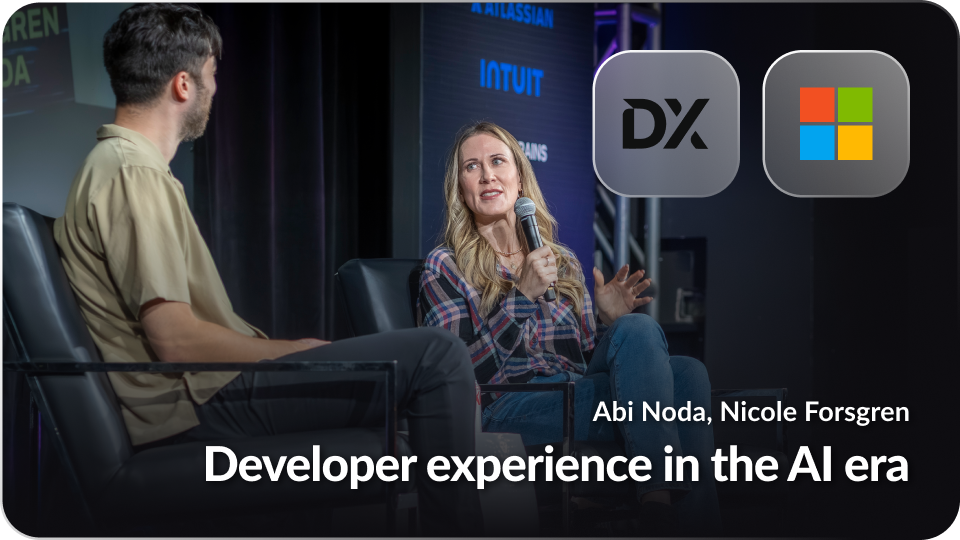
Developer experience in the AI era
Join Nicole Forsgren and Abi Noda for a fireside conversation about on their upcoming book, Frictionless (Aug ’25 release). Learn about the biggest lessons from the book including in-depth strategies for spearheading DevEx programs, measuring developer experience, and how AI is altering the landscape. Attendees will receive exclusive early access to the book.
Watch the video

Debug Less, Deploy More: Intuit’s CI/CD Productivity Evolution
At Intuit, we’re helping developers move faster and smarter by transforming how we build, test, and deploy software. It starts with GenAI-powered failure analysis that reduces time-to-diagnosis from hours to minutes, and continues with a shift toward automated promotions across environments, GitHub Actions, and Argo-powered progressive delivery with built-in auto rollbacks. By reducing friction in debugging and improving deployment confidence, we’ve already made meaningful gains in developer efficiency. Now, we’re leaning into a bold future—aiming to double deployment frequency and slash lead time for change by simplifying CI and enhancing the intelligence of our promotion pipelines. This talk walks through the evolution of our CI/CD platform, the developer pain points we tackled, the cultural shifts that made it all stick, and the future ideal state of our platform. If you’re scaling Developer Experience in a complex org, you’ll walk away with actionable insights—proven strategies your engineers will thank you for!
Watch the video
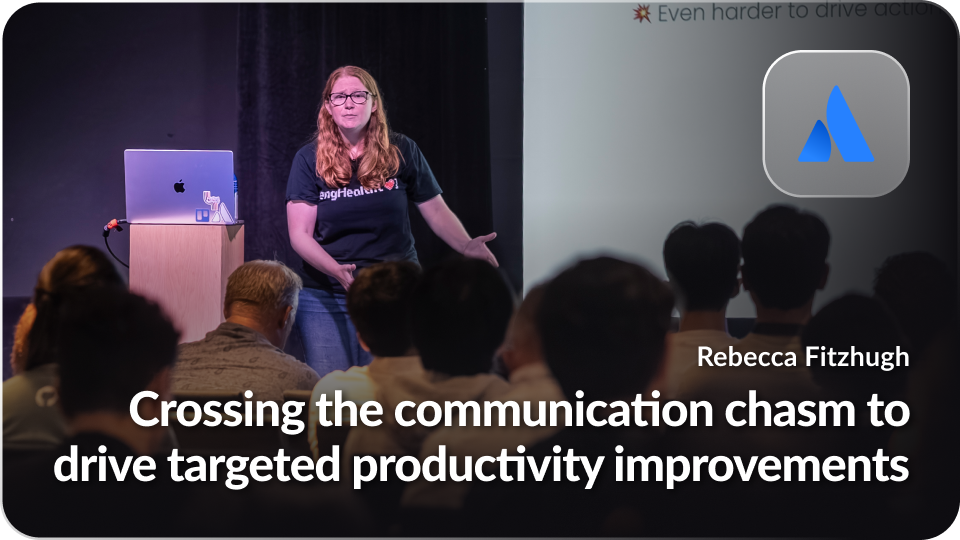
Crossing the communication chasm to drive targeted productivity improvements
Atlassian platform teams are responsible for driving cross-cutting engineering efforts to increase developer productivity and uplift engineering health. This means those teams working on developer productivity have a unique reliance on other teams to ensure the adoption of their platform capabilities – getting code changes into other teams’ codebases is critical to their success. However, we heard through our quarterly DevProd survey that there was an organizational chasm between the product and platform teams, resulting in the product teams being inundated with many requests that often came in sideways without clarity on the actual ask from the platform teams. To be effective in improving developer productivity, we needed to become more effective in communicating with engineering teams across the org and give them clear visibility into upcoming priorities so they can plan ahead. Join us to learn how Atlassian bridged the gap between platform and product teams by using campaigns as the unit of change to effectively scope, target, and communicate changes across hundreds of engineering teams and thousands of services to sustainably drive productivity improvements.
Watch the video
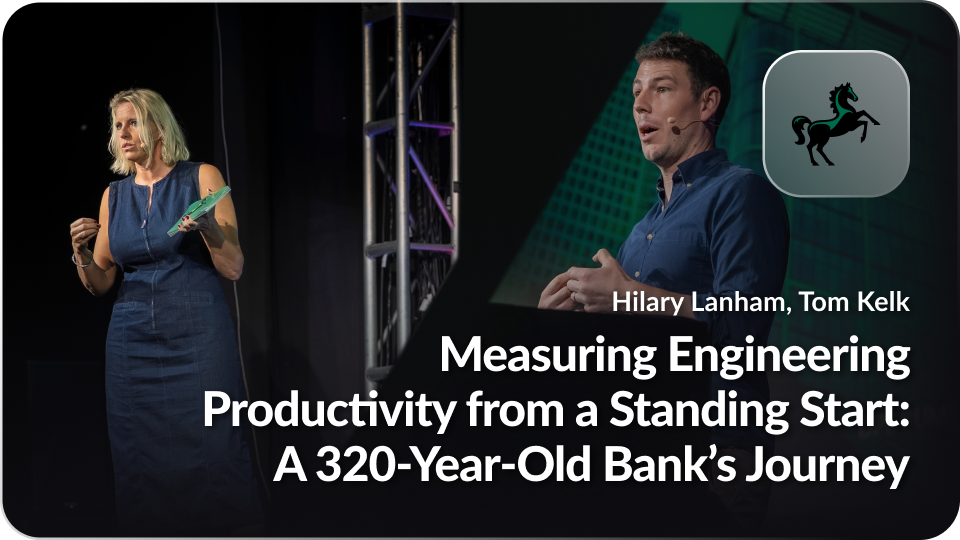
Measuring Engineering Productivity from a Standing Start: A 330-Year-Old Bank’s Journey
How do you begin measuring developer productivity in an organization with centuries of legacy, fragmented engineering practices, and ambitious FinTech aspirations? Join Hilary Lanham and Tom Kelk as they share the journey of introducing Engineering Productivity measurement at Lloyds Banking Group—Britain’s largest bank, now aiming to become the UK’s leading FinTech. In this session, you’ll hear how Lloyds is tackling the challenge of aligning diverse engineering teams post-merger, navigating cultural and technical friction, and building a data-informed productivity strategy from scratch. Learn how they approached: Building a developer productivity strategy from the ground up in a legacy-rich environment Combining qualitative and quantitative insights to shape engineering outcomes Applying a product mindset to drive adoption, engagement, and continuous improvement Turning complex data into meaningful action for teams and stakeholders Whether you’re starting your own productivity journey or scaling an existing one, this session offers practical lessons and strategic thinking from one of the most complex environments imaginable.
Watch the video
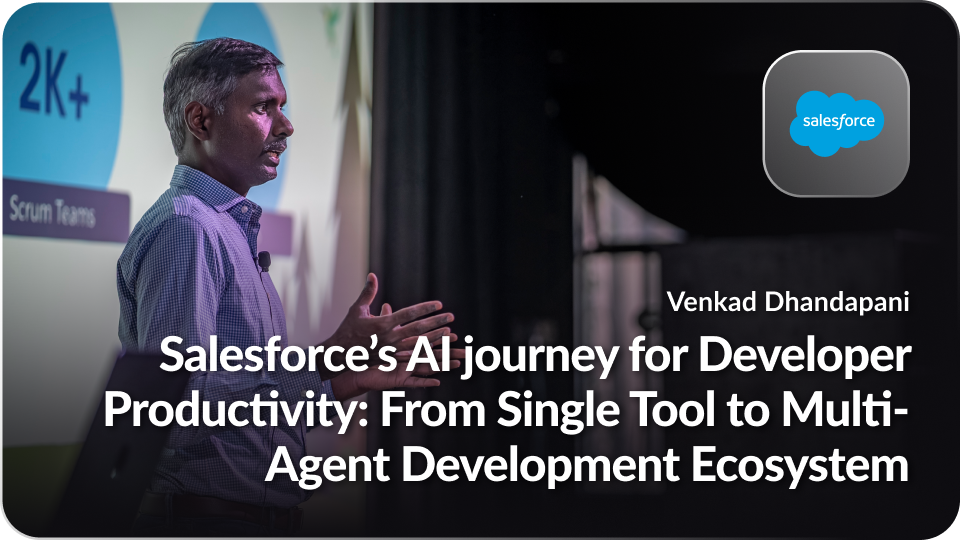
Salesforce’s AI journey for Developer Productivity: From Single Tool to Multi-Agent Development Ecosystem
Salesforce’s AI journey for developer productivity began in early 2023 with a single tool that demonstrated 30+ minutes of daily time savings. The journey accelerated through 2024-2025 with the introduction of Model Context Protocol (MCP) exchanges, AI Rules systems, and specialized tools for code reviews and ambient task agents for automated testing. Today’s ecosystem features multi-tool and multi-agent experience for Developers. This transformation represents a shift from single-tool adoption to an orchestrated multi-agent development environment that amplifies human creativity while maintaining enterprise security and compliance standards.
Watch the video
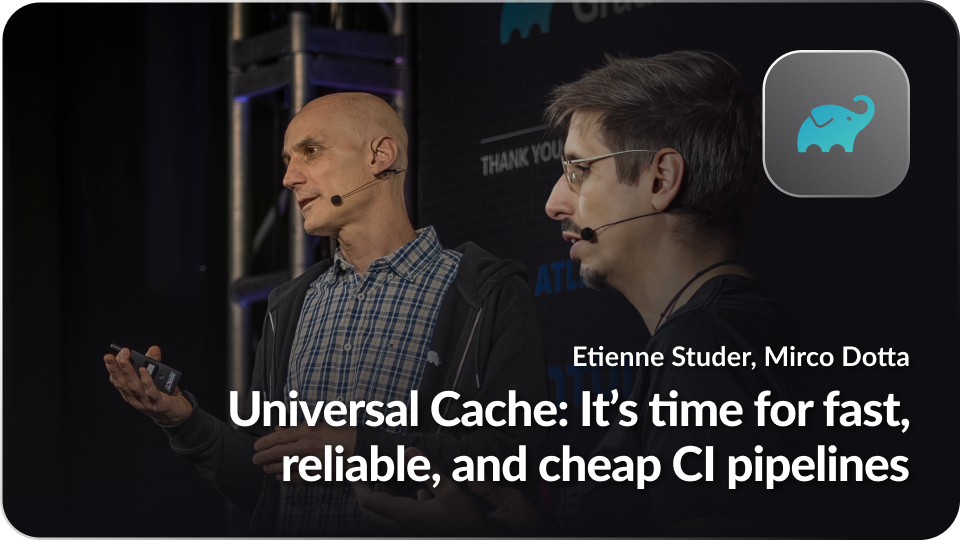
Universal Cache: It’s time for fast, reliable, and cheap CI pipelines
As generative AI continues to drive rapid innovation in software development, the volume of code, tests, and iterations. will only increase. This increased volume creates immense pressure on CI/CD pipelines, leading to longer build times, more load on infrastructure, and higher costs. Infrastructure teams face the growing challenge of managing increasingly complex build pipelines while still getting changes through at the speed of business. Optimizing build performance and reliability is no longer optional — it is critical to maintaining pipeline efficiency and developer productivity, and keeping infrastructure costs under control. In this talk, Etienne Studer, SVP of Engineering at Gradle Inc. and Co-Founder of Develocity, will discuss how observability empowers organizations to pinpoint build performance bottlenecks and surface build toolchain unreliabilities. He will then introduce Universal Cache, a transformative feature designed to cache all critical aspects of a build — from configuration and dependencies to outputs – and applicable to all CI providers and multiple build systems. Attendees will leave with a clear understanding of how observability can pinpoint performance and reliability issues, how Develocity accelerates CI/CD pipelines via Universal Cache, and how data enables organizations to validate the success of these optimizations and their business benefits.
Watch the video
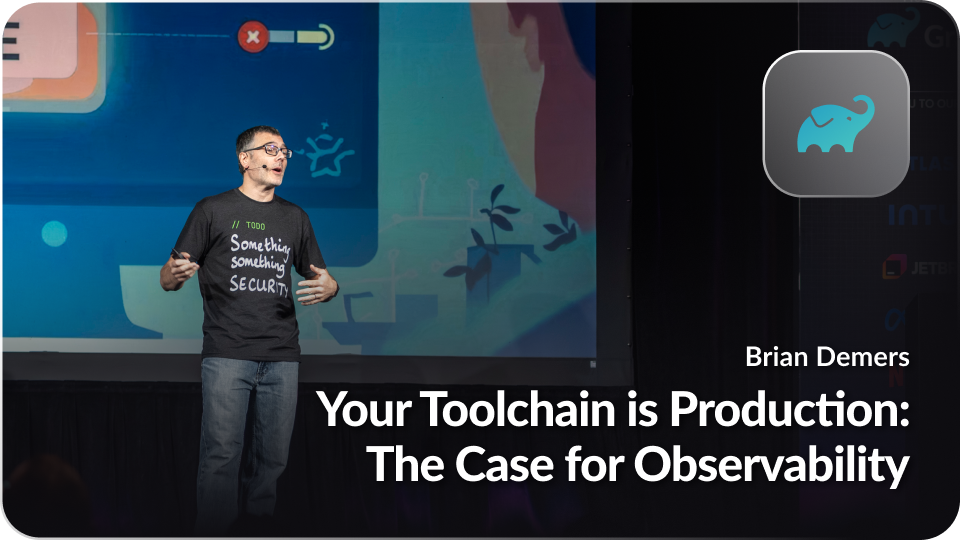
Your Toolchain is Production: The Case for Observability
Let’s face it: your developer toolchain—everything from your local build to your CI/CD pipelines—is a production system. When it goes down, so does your team’s productivity and your ability to ship software. Yet, we often treat it as an afterthought, ignoring the flaky tests, slow builds, and other bottlenecks that hold us back. In this talk, we’ll discuss why treating your toolchain as a critical production system is the key to unlocking better software delivery. We’ll explore how to apply observability practices—using logs, metrics, and traces—to diagnose problems, optimize performance, and improve the developer experience. We’ll also touch on how a well-observed toolchain can simplify governance, risk management, and compliance (GRC). We’ll share practical strategies for getting started and show you how a data-driven approach to your toolchain can dramatically increase your team’s efficiency, reliability, and security.
Watch the video

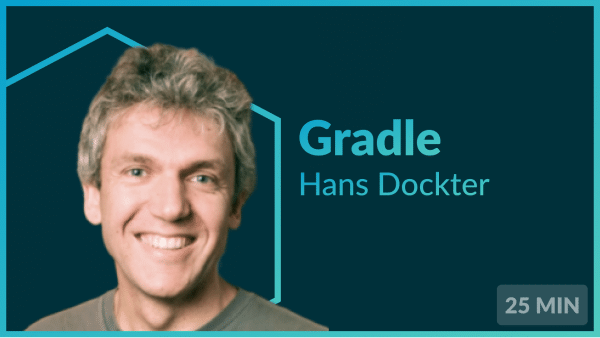
Gradle: Your Build, Your Rules
As your Gradle project gets bigger, it can get harder to make sure everything is built in exactly the way you want it. This talk will be a discussion about building your own Gradle plugin that wraps all other plugins exposing the bare minimum number of knobs to make all subprojects workable. We’ll discuss challenges, creative solutions, inter-plugin cooperation (e.g. Kotlin Gradle Plugin). You’ll hear about tools to ensure your developers stay on the well lit path. A lot of the inspiration for this comes from the experience with the AndroidX library build.
Watch the video
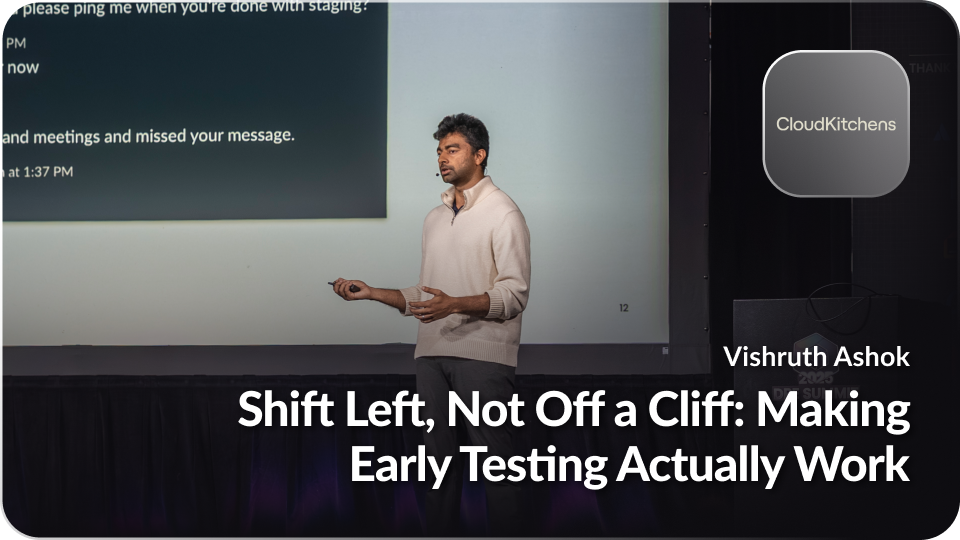
Shift Left, Not Off a Cliff: Making Early Testing Actually Work
“Shift left” has become a mantra in modern software delivery—but in practice, it’s often just a fancy way of saying “give developers more testing responsibilities with less support.” The result? Bloated pipelines, brittle tests, frustrated engineers, and bugs that still sneak through. In this talk, we’ll unpack why early testing initiatives so often fail to deliver real value, and what it actually takes to make them work at scale. We’ll explore the pitfalls of prematurely complex test suites, the myth of perfect unit test coverage, and the hidden costs of bad feedback loops. More importantly, we’ll show how to build a pragmatic, developer-friendly testing strategy that shifts quality left without falling off a cliff. Expect practical tips on test pyramid design, test impact analysis, developer tooling, and how to align QA, dev, and platform teams around meaningful quality goals. Key Takeaways: Why most shift-left efforts fail (and how to avoid it) How to design early-stage tests that catch issues without slowing teams down Balancing test depth with speed and reliability Building shared ownership of quality without overwhelming developers
Watch the video
Watch the Sessions
Explore presentation recordings and slides from our 2024 Summit speakers. Browse them all or filter by topic or company.
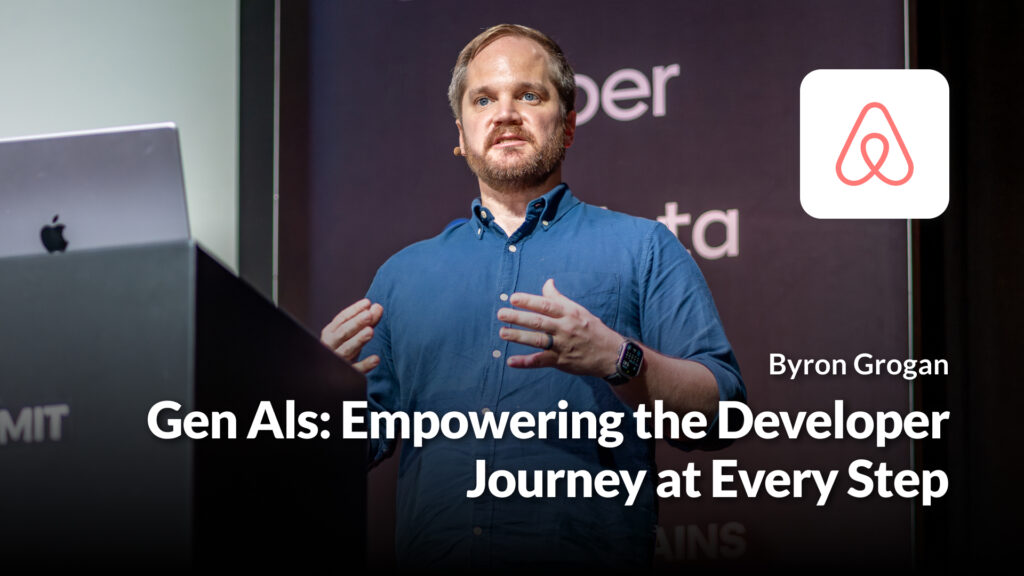
Gen Als: Empowering the Developer Journey at Every Step
Join us to discover how Airbnb harnessed the power of Gen AIs to enhance developer productivity. We will delve into the integration of large language models for code and test generation, as well as the transformative AI Copilot experience within IDEs. Explore the integration points throughout the developer journey that we found the most effective, and gain insights into selecting the best metrics for measuring the impact of AI tools. Let’s make engineering great again with AI!
Watch the video
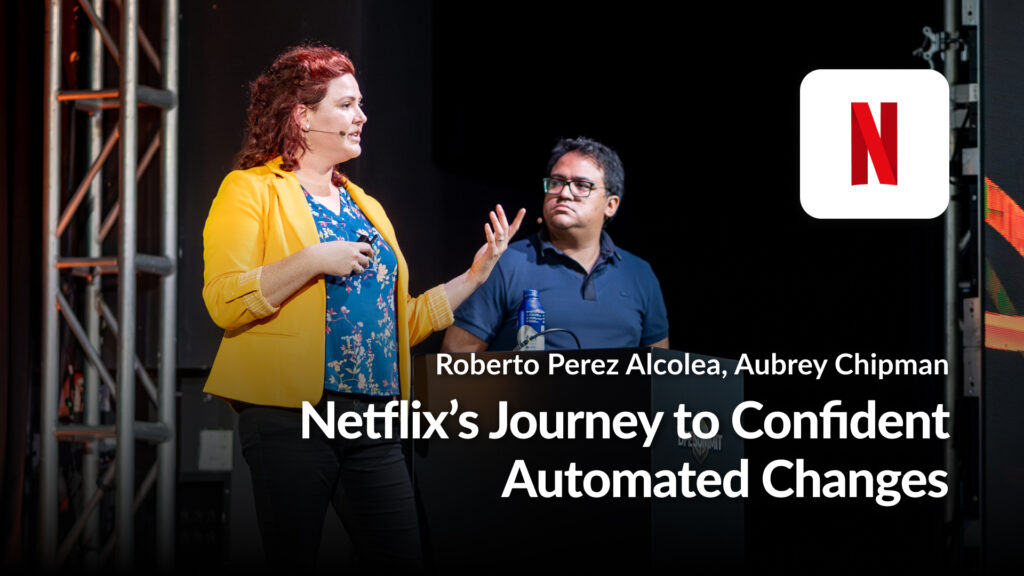
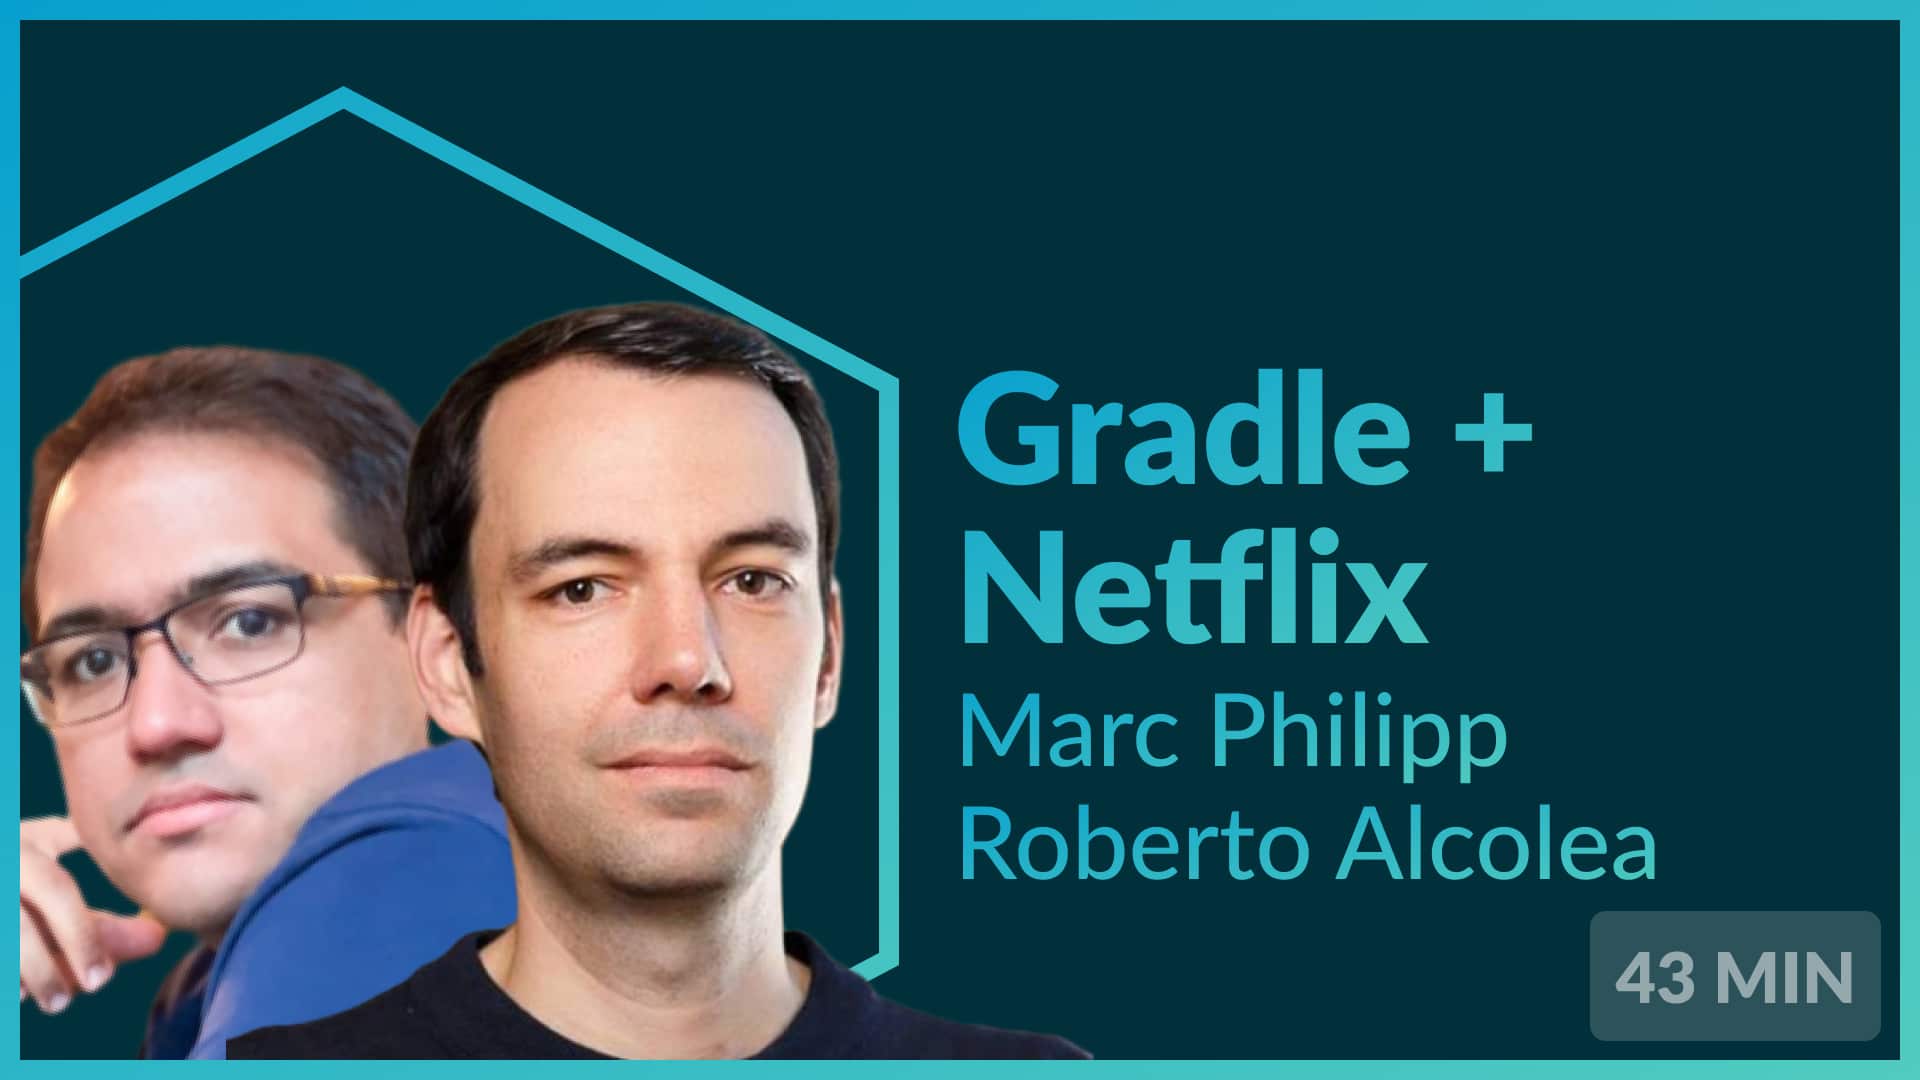
Netflix’s Journey to Confident Automated Changes
This session covers the strategies Netflix uses to increase engineers’ comfort levels (confidence) with receiving and releasing code changes from peers and platform teams automatically (i.e. no human interaction). By investing in confidence-building, Netflix believes it can increase development velocity, improve quality, reduce exposure to security vulnerabilities, and better enable away-team models. Learn how Netflix shares validations and feedback loop data with developers and managers to help them identify where the greatest leverage can be achieved both at a small scale and in aggregate. Key themes include shifting left software verification, developer self-service insights, and failure impact analysis.
Watch the video
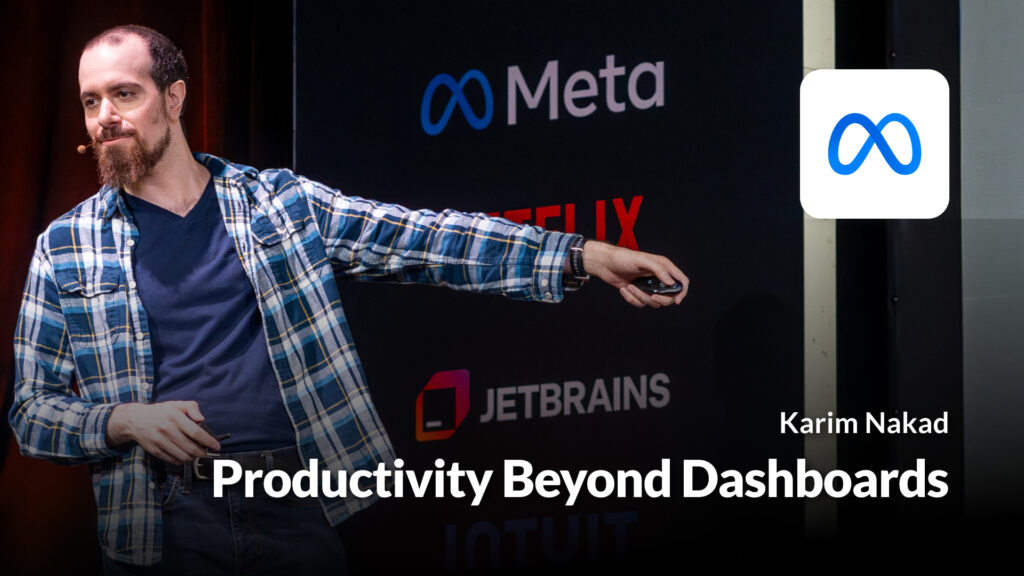
Productivity Beyond Dashboards
Karim will discuss theoretical and practical ways to measure and improve productivity, whether you’re early in your developer productivity journey or a seasoned expert. He will describe common pitfalls when it comes to measuring and surfacing productivity metrics on a dashboard. He will explain the problem with treating dashboards as the end result, and offer an alternative focused directly on productivity improvements.
Watch the video
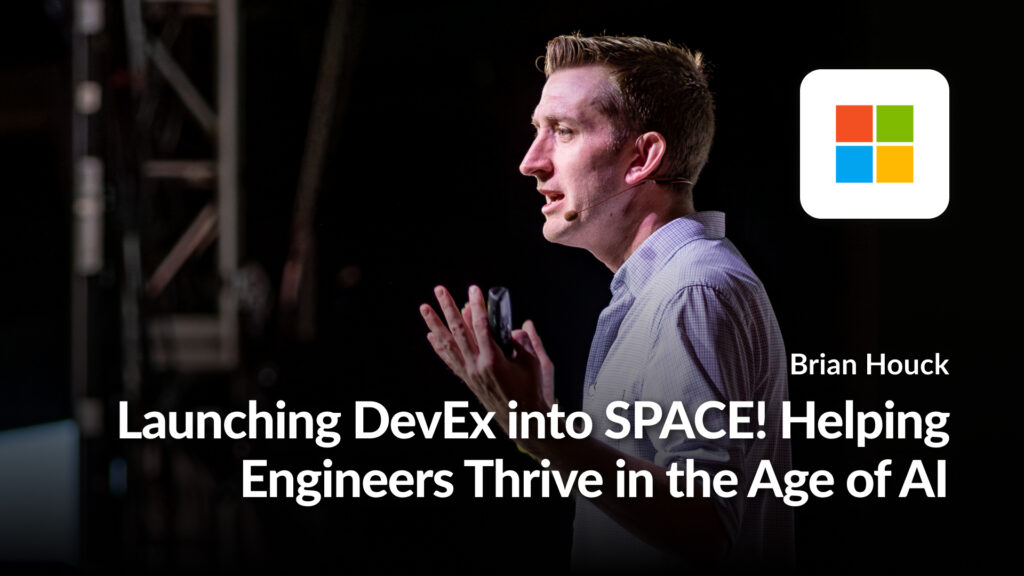
Launching DevEx into SPACE! Helping Engineers Thrive in the Age of AI
Unlocking the productive potential of engineering teams goes beyond just software tools; it’s about shifting the focus back to the driving force behind it all: the developers themselves. Join us for an insightful discussion on how Microsoft leverages a blend of research techniques to understand the human factors impacting developer productivity. We will explore how AI is changing the way developers work, taking an honest look at where it is helping to improve the developer experience and where it isn’t. This session will explore the hopes and concerns developers have with AI head-on. We’ll explore the metrics Microsoft uses to assess developer productivity, explain why these metrics matter, and talk about whether our approach to metrics has changed due to the emergence of AI. How can teams increase the amount of time they have for uninterrupted, focused work? Does hybrid work really work? How much of a difference can a modern office really make on developer productivity? Join us to understand how to help your engineers thrive and to get answers to critical questions about the future of developer productivity in the age of AI.
Watch the video

This Year in Uber’s AI-Driven Developer Productivity Revolution
Across all layers of the Software Development Life Cycle, Uber is investing in AI solutions to help developers “Ship Quality Faster”. Uber has formed a dedicated Developer Platform AI effort that spans many teams to deliver on that mantra. Adam and Ty will share the latest developments in Uber’s AI-driven developer productivity revolution. We’ll share the latest in the coding assistant landscape, including customizations to make them “monorepo aware”, how we’re thinking about large-scale code migrations with agentic systems, and how the test pyramid is being reshaped bottom-up with AI-powered code generation and top-down with probabilistic agents. You’ll leave with actionable strategies for implementing AI solutions in your own organization and a list of ideas for achieving rapid, high-impact results.
Watch the video
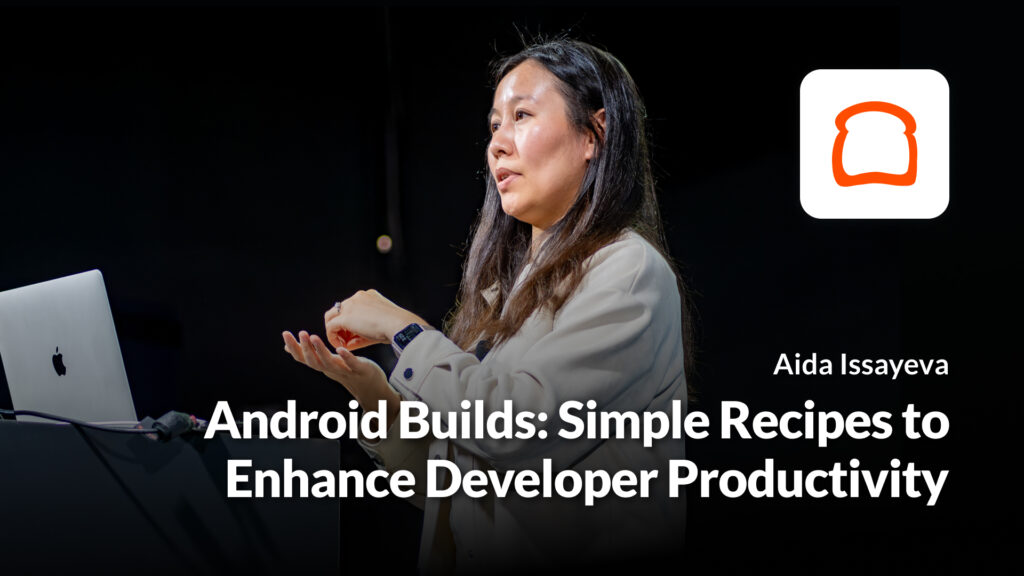
Android Builds: Simple Recipes to Enhance Developer Productivity
Diving into Android build optimizations, this talk revisits seemingly minor adjustments that hold untapped potential for speeding up your build process. Often overlooked or underestimated, these simple tweaks can be game-changers in enhancing build efficiency. I’ll share insights from my experience at Toast, where basic changes led to significant improvements, reminding you to give these solutions a second glance. Whether it’s fine-tuning Gradle properties, leveraging incremental builds, or optimizing resource usage, this session aims to highlight the often-skimmed solutions that might just be the key to a faster build. This session is ideal for developers looking to improve build times and enhance productivity, demonstrating that sometimes the most impactful optimizations are also the most accessible.
Watch the video
Boosting Developer Productivity Through Better Modularity
Modularization and reuse of modules, through some form of dependency management, are a central part of every larger software project. While most projects have well-defined modularity when they start off, they often end up in a chaotic setup – also referred to as “dependency hell” – after a few years of development. And all too often, there is no ambition to get out of that again until a project reaches an almost unmaintainable state. Not investing in this area earlier is usually a bad business decision. Issues in the modularity setup of a project have a negative impact on developer productivity in many ways that not only make the daily work of developers inefficient but also worsen the problems over time. In this session, we look at how these problems arise, the influence they have on developer productivity, and why they are so often invisible or ignored. In particular, we identify “accidental complexities” and separate them from “essential complexities” in this area. We then explore which tooling helps us to avoid the accidental complexities and deal with the essential complexities in a sustainable way. Based on this, we share ideas for future developer productivity tools and features that could be added to existing build and DPE tools like Gradle or Develocity. What we discuss in this session is based on experiences gained through helping multiple large Java projects get back to a maintainable modularity setup. Although we use Java, Gradle, and Develocity in examples, the concepts presented can be transferred to other languages and tools.
Watch the video

Speed Up Your Maven Build x10…Before You Move to Gradle
Gradle has a lot of performance advantages in comparison to Maven. But there are still several ways to speed up Maven builds. Simple: Upgrade hardware, upgrade JDK, use proper JDK for your arch (e.g. Apple Silicon) Parallel execution, “mvn -T1C” in .mvn/maven.config maven.test.skip=true (relates to get rid of test-jar dependencies) Kotlin K2 compiler Develocity Extension Middle: Stop deploying redundant artifacts on each build Split large modules to smaller (explanation why it makes sense, comparison with Gradle) Remove redundant dependencies Get rid of “test-jar” dependencies Extract code generation to jar dependency Complex: Get rid of AspectJ compiler (25% of compile time) Paid: Develocity with remote cache Additional topics: mvnd as way to visualize parallelization bottlenecks (alternate to Develocity or other plugins) IDEA: parallel compilation Eventually migrate to Gradle to have new opportunities. Some advice for Maven works for Gradle projects as well
Watch the video
How We Automated Code Maintenance and You Can Too!
Let’s face it: as developers, we dedicate a third of our time to code maintenance, which includes tasks such as upgrading dependencies, addressing security vulnerabilities, and removing obsolete code. This is tedious and repetitive. Neglecting regular maintenance can lead to costly outcomes, including unexpected crashes, and it makes the codebase more difficult to understand and evolve. However, automation of these tasks is not always straightforward. Existing tools such as security scanners and feature flag systems warn you about the issues or obsolete code, but fall short of automatically rectifying these problems. Tools that upgrade dependencies merely increase the version number, leaving engineers to handle any API compatibility issues. Automating code changes is hard, and the polyglot nature of modern development makes it harder. In this talk, we will delve into code rewriting techniques such as pattern matching, program analysis, and AI. We will illustrate how we leveraged the complementing power of these tools to generate over 1,800 automated pull requests, eliminating or refactoring more than 500,000 lines of code. In this talk, you will also learn how to harness the power of these tools to drive down tech debt, ensuring your codebase is not only functional but also future-proof.
Watch the video
Reducing Build Times by 50%: A Story of Tools, Data, and Persistence
Over the past year at Peloton, we’ve invested heavily in stabilizing and optimizing our complex build system, resulting in a build time reduction of over 50%. We’ll talk about the importance of observability, prioritizing stability, and optimizing for speed.
Watch the video
DragonCrawl: Shifting Mobile Testing to the Left with AI
The Developer Platform team at Uber is consistently developing new and innovative ideas to enhance the developer experience and strengthen the quality of our apps. Quality and testing go hand in hand, and in 2023, we took on a new and exciting challenge: to change how we test our mobile applications, with a focus on machine learning (ML). Specifically, we are training models to test our applications just like real humans would. Mobile testing remains an unresolved challenge, especially at our scale, encompassing thousands of developers and over 3,000 simultaneous experiments. Manual testing is usually carried out but with high overhead and cannot be done extensively for every minor code alteration. While test scripts can offer better scalability, they are also not immune to frequent disruptions caused by minor updates, such as new pop-ups and changes in buttons. All of these changes, no matter how minor, require recurring manual updates to the test scripts. Consequently, engineers working on this invest 30-40% of their time on maintenance. Furthermore, the substantial maintenance costs of these tests significantly hinder their adaptability and reusability across diverse cities and languages (imagine having to hire manual testers or mobile engineers for the 50+ languages that we operate in!), which makes it really difficult for us to efficiently scale testing and ensure Uber operates with high quality globally. To solve these problems, we created DragonCrawl, a system that uses large language models (LLMs) to execute mobile tests with the intuition of a human. It decides what actions to take based on the screen it sees and its goals, and independently adapts to UI changes, just like a real human would. Of course, new innovations also come with new bugs, challenges, and setbacks, but it was worth it. We did not give up on our mission to bring code-free testing to the Uber apps, and towards the end of 2023, we launched DragonCrawl. Since then, we have been testing some of our most important flows with high stability, across different cities and languages, and without having to maintain them. Scaling mobile testing and ensuring quality across so many languages and cities went from humanly impossible to possible with the help of DragonCrawl. In the three months since launching DragonCrawl, we blocked ten high-priority bugs from impacting customers while saving thousands of developer hours and reducing test maintenance costs. In this talk, we will deep dive into our architecture, challenges, and results. We will close by touching a little on what is in store for DragonCrawl.
Watch the video
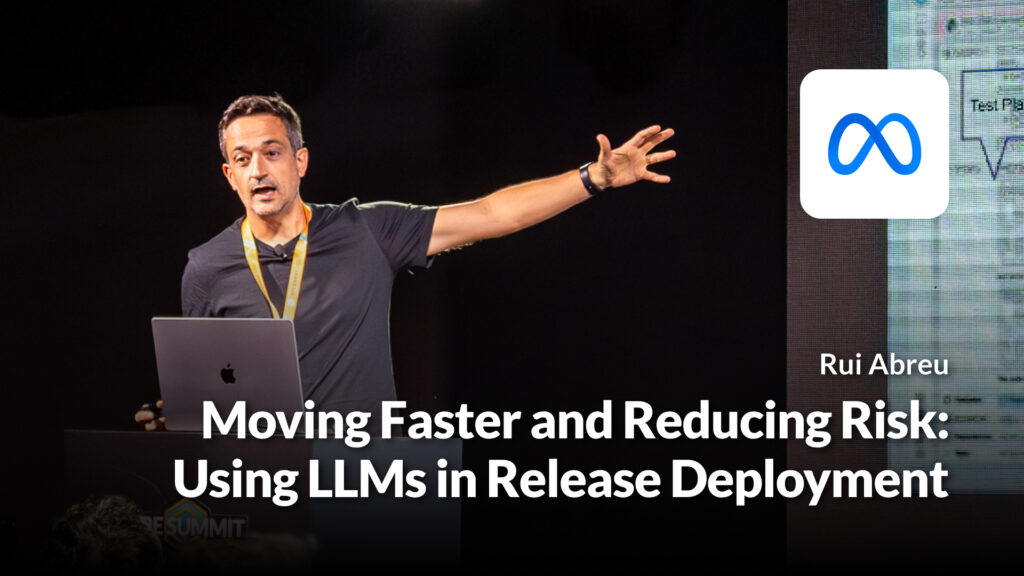
Moving Faster and Reducing Risk: Using LLMs in Release Deployment
This talk discusses the challenge of determining what should be released in large-scale software development, such as at Meta’s scale. To address this, we developed models to determine the risk of a pull request (diff) causing an outage (aka SEV). We trained the models on historical data and used different types of gating to predict the riskiness of an outgoing diff. The models were able to capture a significant percentage of SEVs while gating a relatively small percentage of risky diffs. We also compared different models, including logistic regression, BERT-based models, and generative LLMs, and found that the generative LLMs performed the best.
Watch the video

Strategies for Enhancing Performance of Large-Scale CI Builds
Discover how Block’s Android DevEx team optimized CI performance in a large-scale CI system using advanced Gradle techniques and optimizing ephemeral worker setup. This talk will cover strategies for enhancing build speed and efficiency, managing thousands of simultaneous jobs, and improving CI infrastructure to handle extensive workloads.
Watch the video

Taming the Monorepo Beast: Bearable Library Releases at Scale
AndroidX is a set of hundreds of libraries from dozens of separate teams. These libraries ship releases every couple of weeks from our monorepo. Join me to learn what we’ve done to enable shipping all of these libraries with a manageable amount of pain.
Watch the video
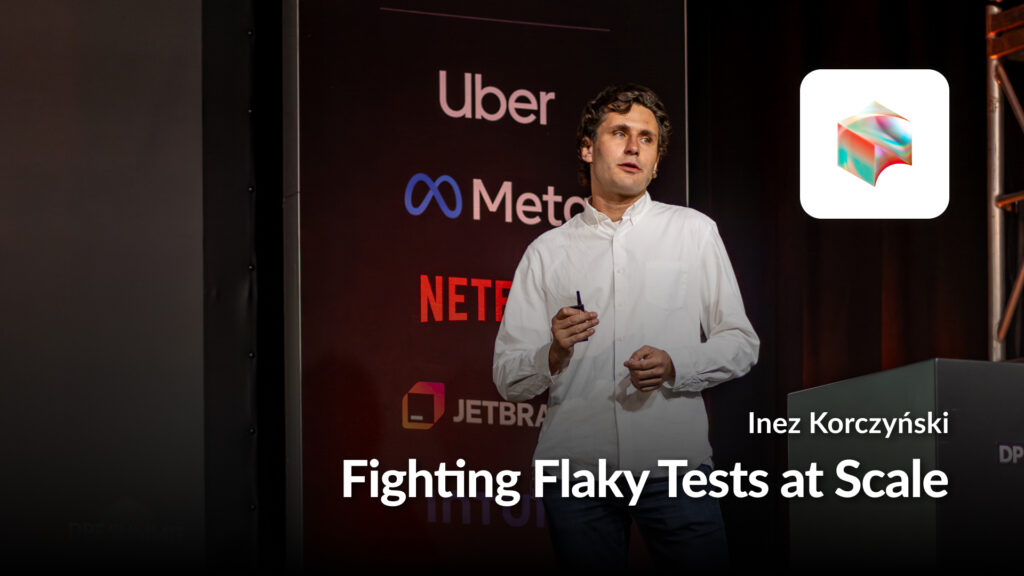
Fighting Flaky Tests at Scale
Flaky UI and unit tests have long been a bane for many mega repositories at Block. In this talk, we will share our journey of tackling flaky tests head-on through both offensive and defensive strategies. Learn how we implemented key changes to our engineering culture and processes to gain control over these elusive issues. Join us to discover practical insights and actionable steps to improve the reliability of your test suites at scale.
Watch the video
Maintaining Builds at Scale
As the quantity of code grows, so does the complexity of managing it. Even if you do everything right, follow every best practice, never make a bad design decision, scale brings problems. Modern software projects have extensive lists of first and third-party dependencies and tools. Each dependency has its own usually unpredictable cadence of releases and vulnerability disclosures. As complexity increases, these costs scale exponentially. Software engineers must constantly strain against these tides or be swept away to obsolescence. In this talk, we will explore practical strategies and tools for automating the maintenance and modernization of builds across extensive codebases. We will dive into using OpenRewrite, a powerful set of tools for automating updates to code, data, and build logic. Using OpenRewrite, organizations can perform framework migrations, update dependencies, and integrate new tools such as Develocity, all while maintaining consistency and reliability across thousands of repositories. Discover the challenges faced, accomplishments achieved, and the path ahead for maintaining builds at scale. Join us to learn how OpenRewrite can transform your build maintenance practices, ensuring your projects remain robust, up-to-date, and ready for future developments.
Watch the video
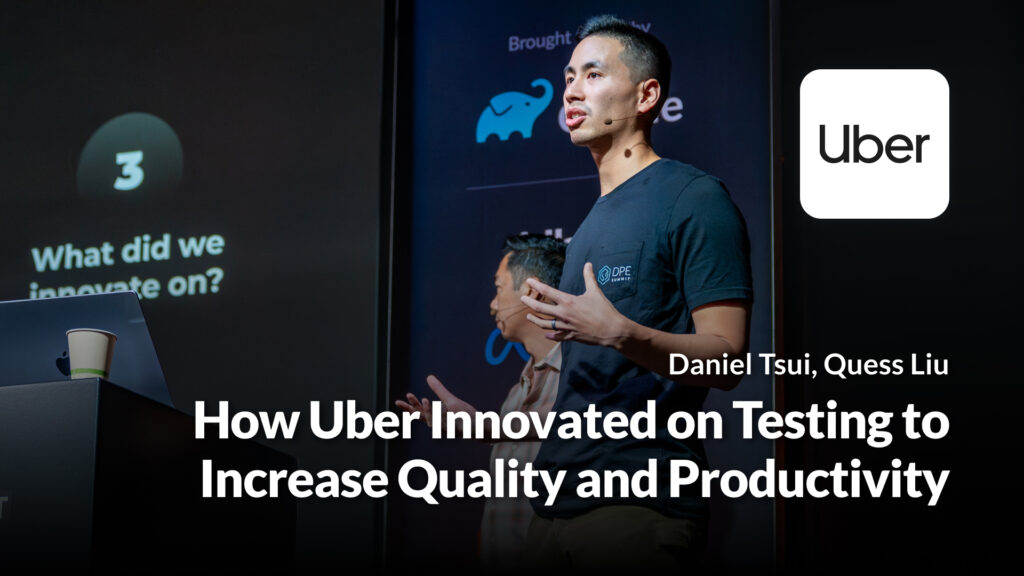
How Uber Innovated on Testing to Increase Quality and Productivity
Testing is usually associated with quality, but can it also improve productivity? Take a peek at how Uber is pushing the boundaries of testing with innovation and AI. Learn how Uber shifted end-to-end testing left to gate 50% of their code and config changes pre-land with thousands of tests resulting not only in a 70% reduction in outages caused by code change, but also increased developer productivity by preventing disruptive changes from ever landing into the code base.
Watch the video
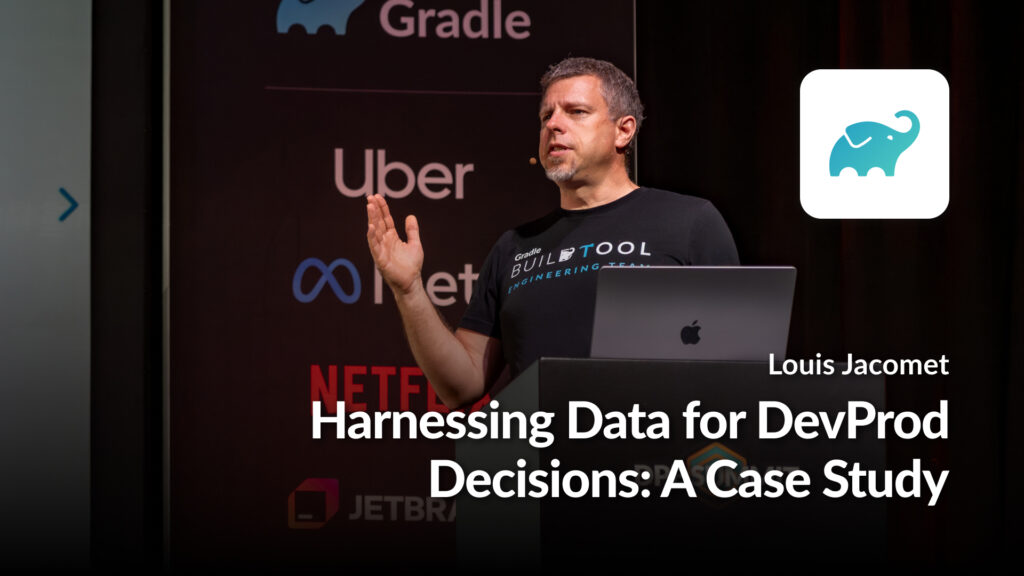
Harnessing Data for DevProd Decisions: A Case Study
Build Scan and Develocity are game changers in collecting data on key elements of developer productivity: building and testing code. This innovation lies in the seamless integration of data collected from continuous integration environments with data collected from developer environments. For the Gradle Build Tool project, this represents more than a million Build Scans retained in the public Develocity instance at https://ge.gradle.org. Some of that data is leveraged to show the different Develocity screens. But the system contains so much more data. What can we learn from it? What kind of analysis can we run on it? In this session, we will explore how the Gradle Build Tool Engineering team leveraged the data collected on https://ge.gradle.org to identify potential issues, measure the impact of changes, and confirm that they have a positive effect. What did we improve? What surprised us? Join this session to discover the answers to those questions.
Watch the video

Pursuit of Universal Ownership
In the tech industry, a common and critical challenge is managing ownership of assets, especially as teams and priorities change over time. This problem is amplified during outages or critical issues, where identifying the responsible party can consume a significant amount of time. To address this, LinkedIn developed the concept of Crews, which are organized groups responsible for maintaining key infrastructure and assets. Crews ensure clear accountability and ownership, independent of individual user names, accommodating the natural mobility of people who are more likely to change teams than companies. Our backend service integrates with Workday to understand the employee hierarchy, enabling dynamic team management and asset ownership handshaking. The frontend provides intuitive interfaces for managing these relationships, ensuring every asset has a clear owner. We started by enabling true ownership for 15,000 repositories and services, and are now scaling to manage tens of millions of assets across various types and groupings, making it a robust solution for any organization’s needs.
Watch the video
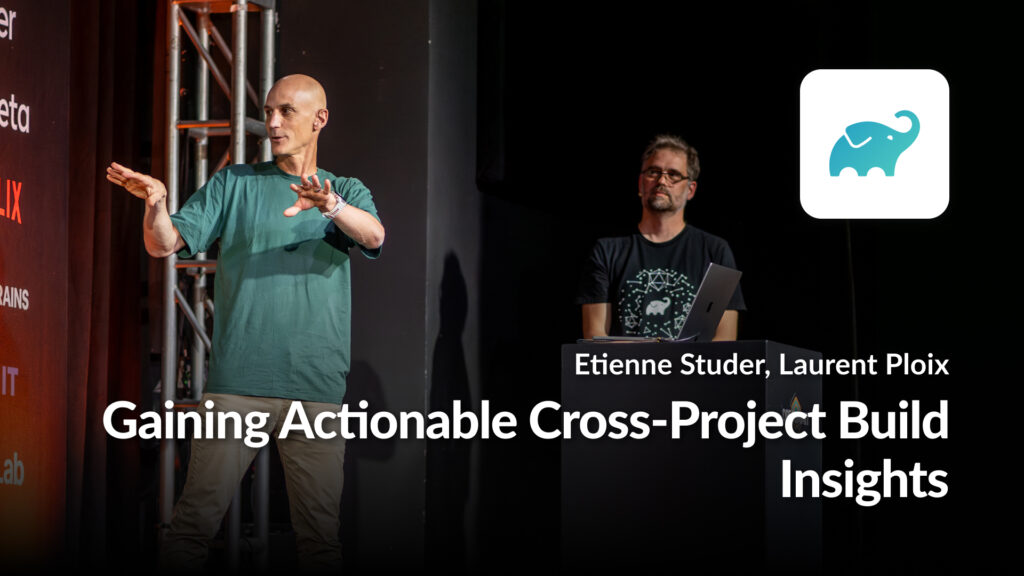
Gaining Actionable Cross-Project Build Insights
Set up a toolchain that allows you to efficiently gain actionable insights where you will get the most build reliability and acceleration improvements in return for your investment. This presentation will explain the toolchain of CI plugins to inject the DV configuration and capture all CI builds Using DRV to determine which projects require the most attention Using experiments, BVS, and other measures to perform the optimization and stabilization actions The primary focus will be on #2, DRV.
Watch the video
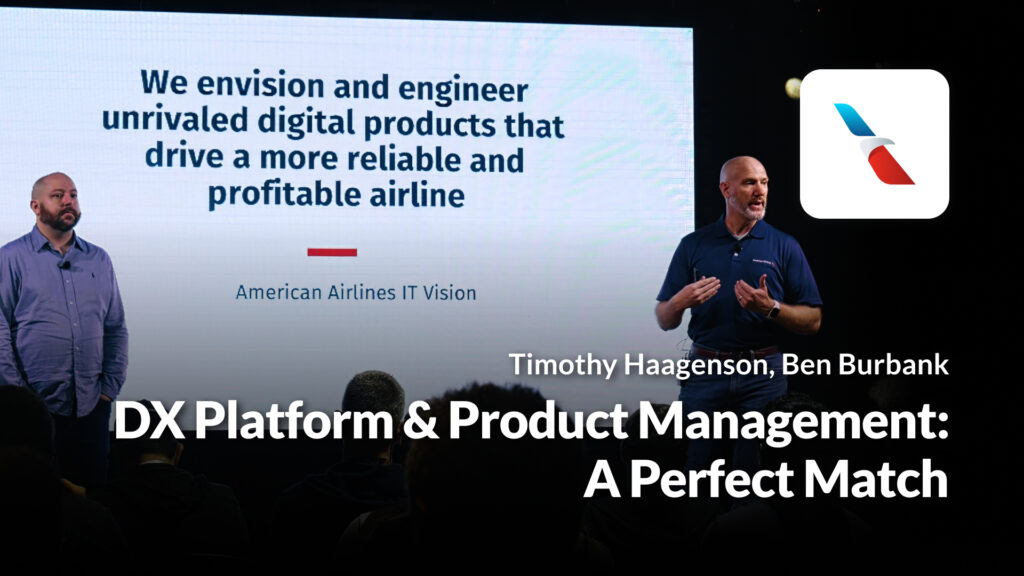
DX Platform & Product Management: A Perfect Match
American Airlines, the world’s largest airline, has been working on developer experience for many years to allow developers to work in more efficient ways through a delightful developer platform. In 2020, they made the decision to have Backstage be the foundation of “Runway,” their developer platform and have grown a large plugin ecosystem around their expansive platform to enable delivery faster and safer. In this talk, they will discuss their initial hackathon strategy, engaging the Backstage community, UX flow, templates, improving feedback loops, and much more. By bringing together the pieces developers need to do their jobs, there is much less friction, developers spend more time writing code, and developer experience has improved.
Watch the video
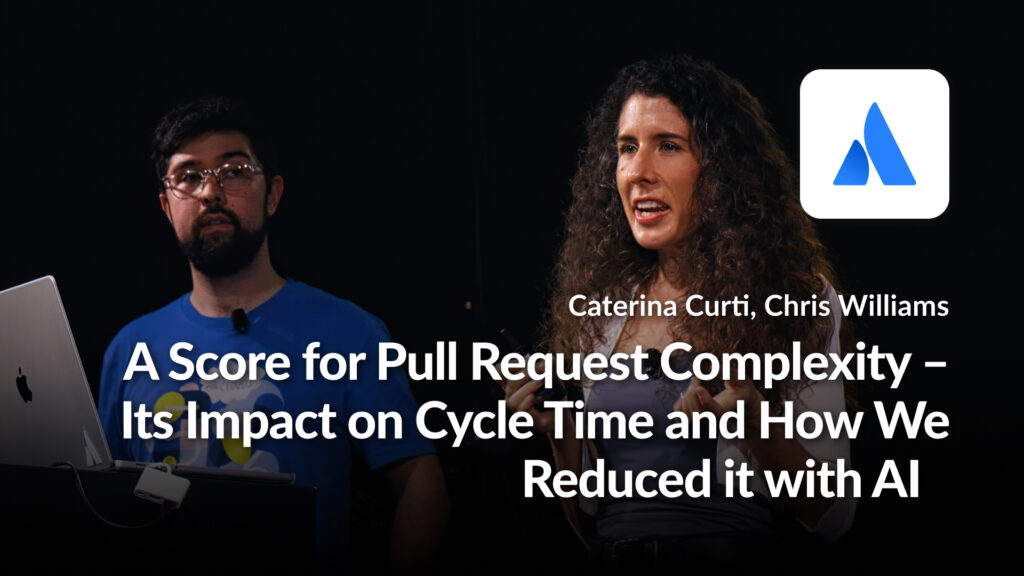
A Score for Pull Request Complexity – Its Impact on Cycle Time and How We Reduced it with AI
A shorter pull request (PR) cycle time is essential for improving developer experience, but too often, pull requests are too complex, touch too many files, and require too many iterations to be quickly and thoroughly reviewed by a peer. The analysis of our data at Atlassian indicates that this results in longer PR cycles and release time. In this session, we’ll introduce the PR Complexity Score, how we calculate it, and how it helps identify PRs that should be reworked before being submitted for review. We’ll share how we make its value prominent and explain its meaning within the context of a pull request as part of a recent project we ran. Taking it a step further, we will illustrate how AI can assist by suggesting ways to simplify the changes. Achieving faster approval for PRs is possible, and optimizing release time will be beneficial for everyone!
Watch the video
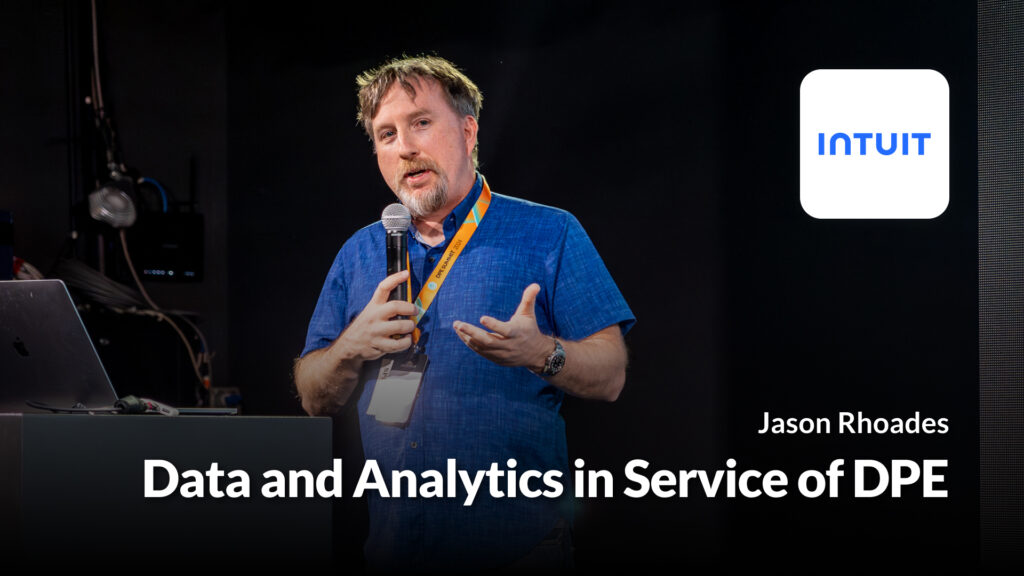
Data and Analytics in Service of DPE
See how Intuit instrumented its development processes to understand and then optimize its development speed and quality.
Watch the video

Mobile Developer Productivity Engineering at Europe’s Largest Online Fashion Store
In this talk, we discuss Developer Productivity Engineering (DPE), and why and how more and more organizations, including Zalando, are investing heavily in this relatively uncharted discipline. We will begin our discussion with a systematic review of DPE approaches in the industry and provide insights into Zalando’s evidence-based approach to DPE Strategy. Finally, we will outline how we executed our app DPE strategy, resulting in significant app health and productivity wins.
Watch the video
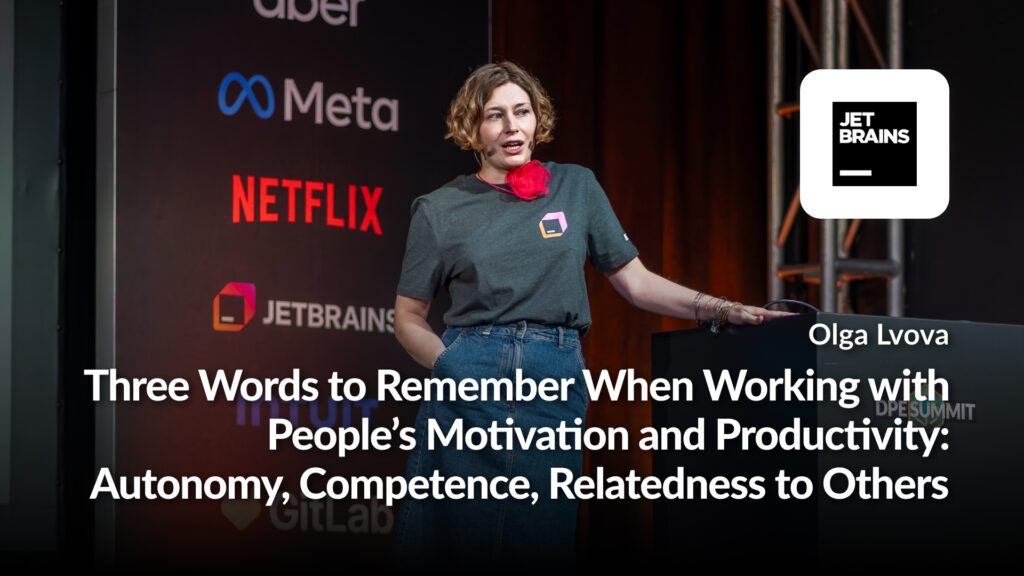
Three Words to Remember When Working with People’s Motivation and Productivity: Autonomy, Competence, Relatedness to Others
This talk will highlight the view of cognitive psychologists on DP and DX. It aims to help DPEs in their decisions about people and processes, providing them with a short and useful theoretical framework taken from social and organizational psychology. In this talk, I will uncover how the senses of being autonomous, competent, and related to other people (a.k.a. The Self-Determination Theory’s three main pillars) influence satisfaction, efficiency, and communication dimensions, and thus overall developer productivity and experience. I will dissect the Self-Determination Theory and discuss concrete strategies to foster developers’ subjective experiences within your teams to boost their satisfaction and productivity based on comprehensive research data. Here are a few examples of how autonomy, competence, and relatedness to others manifest themselves in the everyday tasks of software developers.: Developers’ feeling of autonomy is higher when coding and lower when they are in meetings or writing emails. Developers’ feeling of competence drops when they are bugfixing When developers help colleagues, they experience higher levels of competence and relatedness to a team (Russo et al., 2023). Having in mind three core subjective feelings – feeling of autonomy, competence, and relatedness – when making decisions either about people problems or about tooling, will boost satisfaction and productivity in your engineering teams.
Watch the video
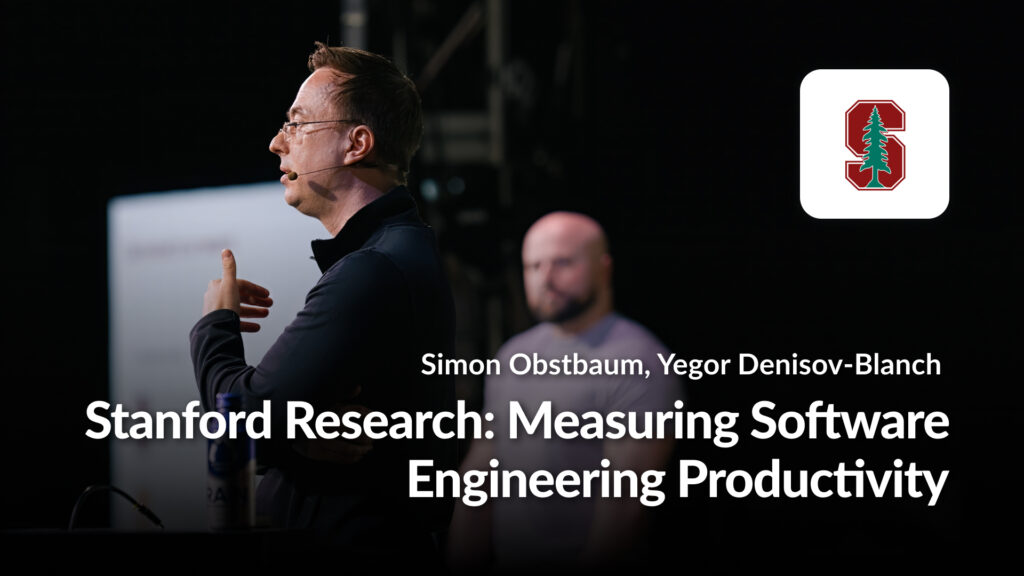
Stanford Research: Measuring Software Engineering Productivity
Effective decision-making in software organizations relies on good data: you can’t improve what you don’t measure. Current ways of measuring software org productivity are flawed and may encourage counterproductive behavior. We propose a new approach to measuring productivity, developed through years of Stanford research.
Watch the video
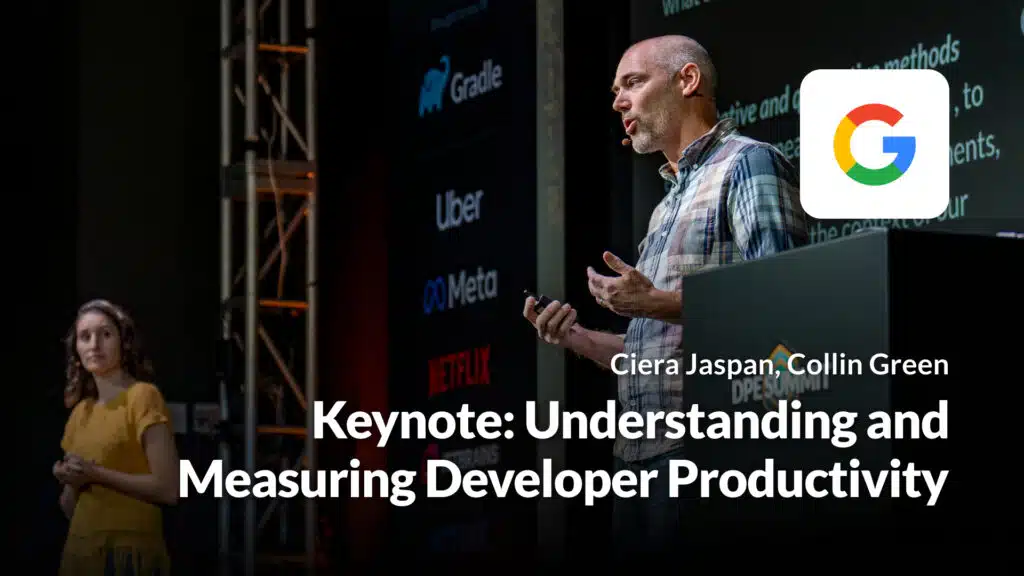
Understanding and Measuring Developer Productivity
In this talk, we will describe how our team uses mixed-methods research to understand and measure developer productivity and provide a couple of examples of how our studies impacted decisions about developer tooling within Google.
Watch the video
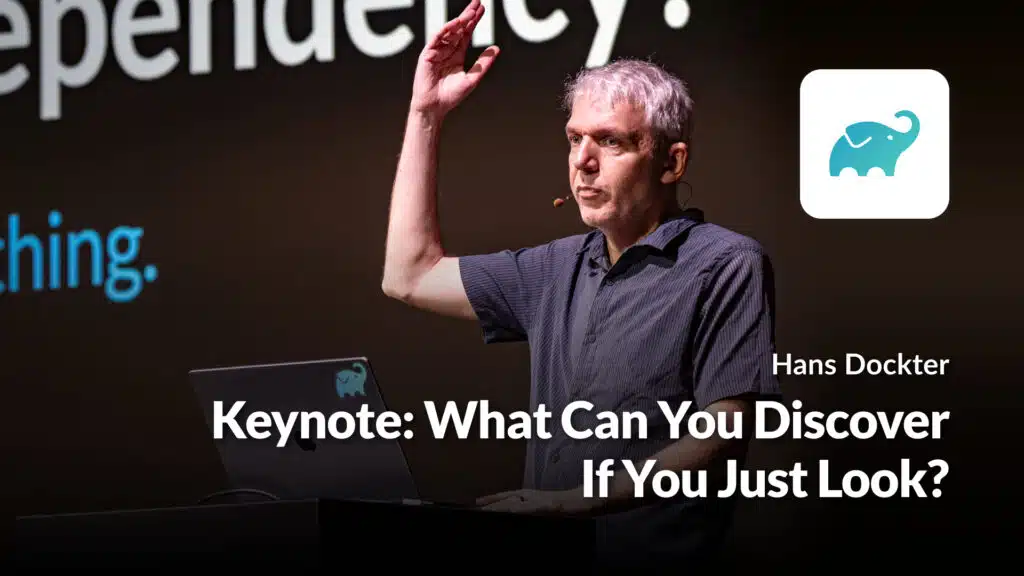
What Can You Discover If You Just Look?
We need observability on the path to production to gather the data to identify bottlenecks and friction in the tools and processes developers use. This means having visibility into developers’ local development environments and the staging environments (including CI) that the code goes through before finally being deployed to production. These environments are the production environments for creating software, and without visibility into what’s happening here, we don’t know what blockages or security issues are on there. What differentiates DPE from other related disciplines? It’s the “E” for “Engineering”. DPE uses engineering practices to identify and address issues like these. An engineering approach means: Formulating hypotheses Gathering data to support or reject the hypotheses Acting upon the data Having observability on our path to production is fundamental to gathering the data required for this approach, and even enables us to identify problems we weren’t aware of. During this keynote, Hans will show examples of how this works in practice.
Watch the video
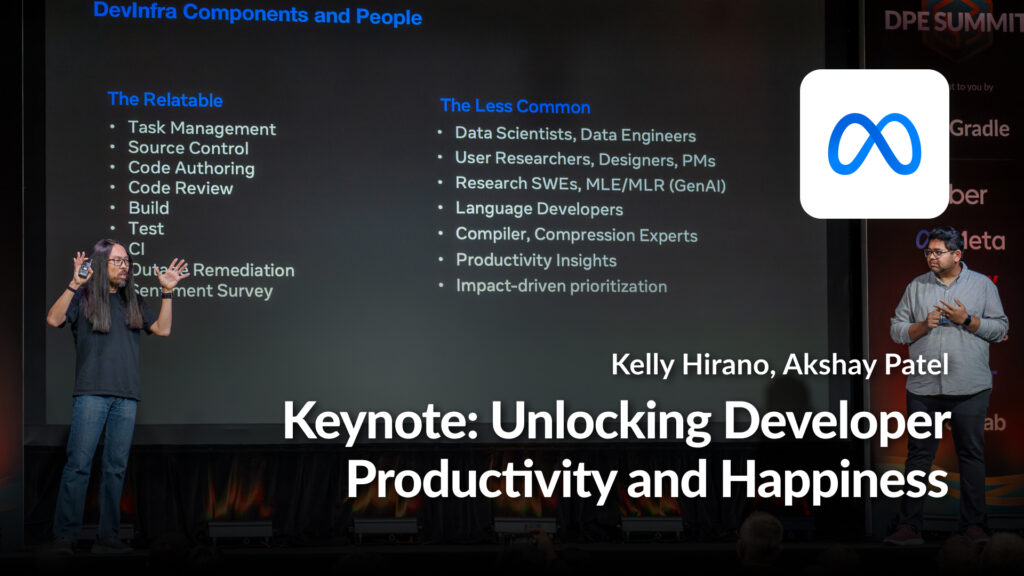
Unlocking Developer Productivity and Happiness
Meta’s approach to a Productivity framework and our journey tying it to both business outcomes and developer happiness.
Watch the video
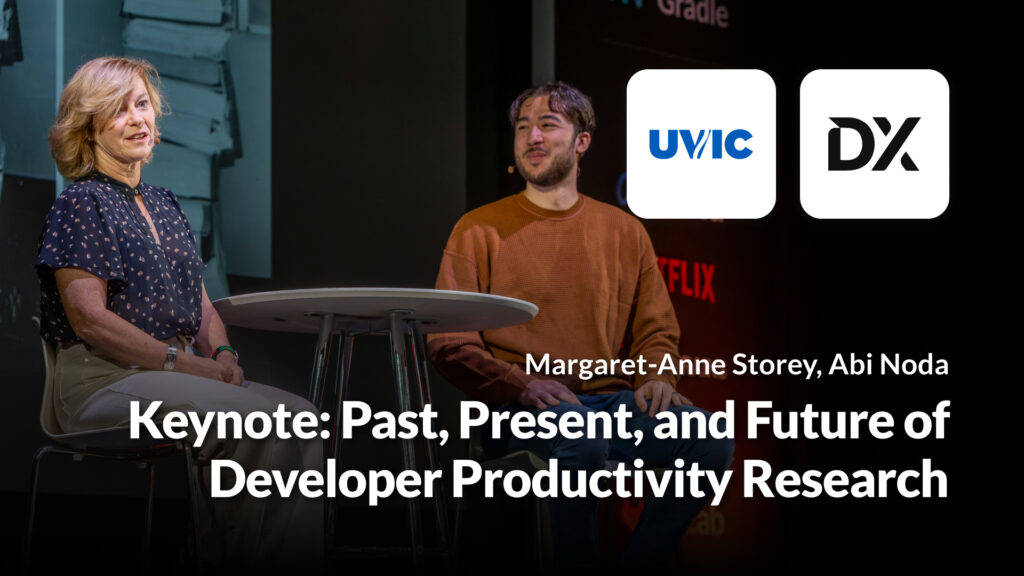
Past, Present, and Future of Developer Productivity Research
Join Abi Noda (CEO of DX) and Margaret-Anne Storey (co-author of DevEx and SPACE, University of Victoria) for a fireside chat that explores the evolution of developer productivity research. They’ll dive into the backstory of DevEx, SPACE, and the just-published DX Core 4—while sharing candid perspectives on current challenges.
Watch the video
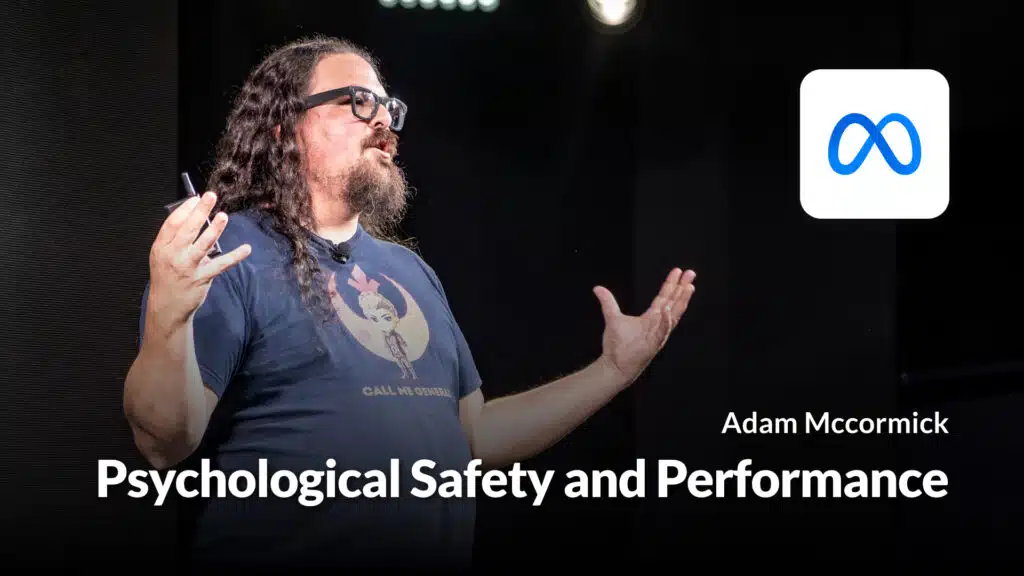
Psychological Safety and Performance
The biggest threats to the long-term health of any development organization are brain-drain and burnout. Retaining the people who make your organization successful and keeping them functioning are the most critical objectives in productivity engineering. Yet to many companies, these ideas seem like an afterthought or a convenience rather than the critical components they are. Come with me as I explore a couple of the worst choices you can make in structuring your dev organization and what to do instead.
Watch the video
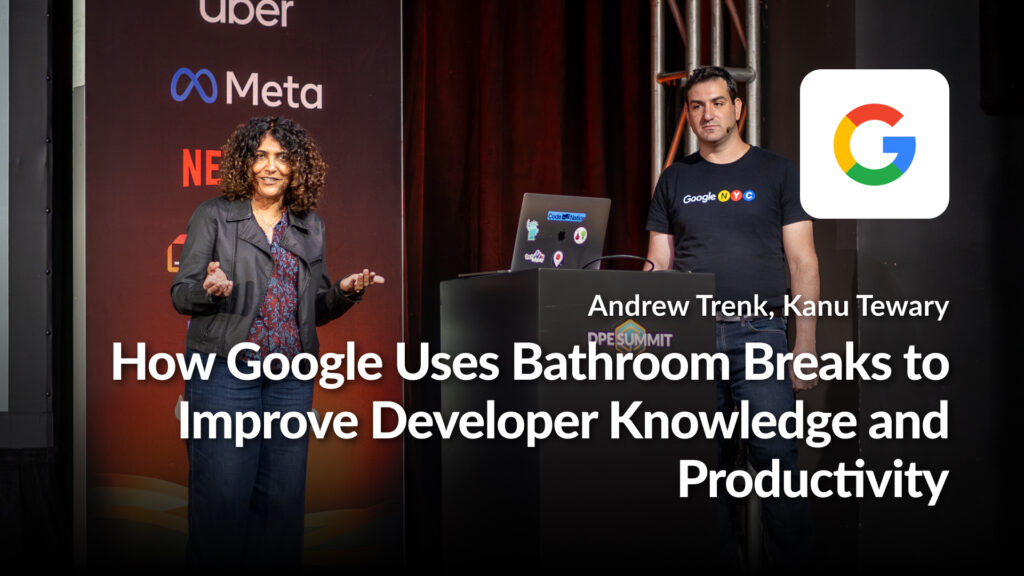
How Google Uses Bathroom Breaks to Improve Developer Knowledge and Productivity
Tech on the Toilet is a weekly one-page publication about software development that is posted in bathrooms in Google offices worldwide and is read by tens of thousands of Google engineers. It is one of the most effective ways to quickly spread software development knowledge across Google. It covers topics such as code quality tips, unit testing best practices, and developer productivity tools. This talk will give an overview of the Tech on the Toilet program, and share lessons learned that can be applied at other companies.
Watch the video
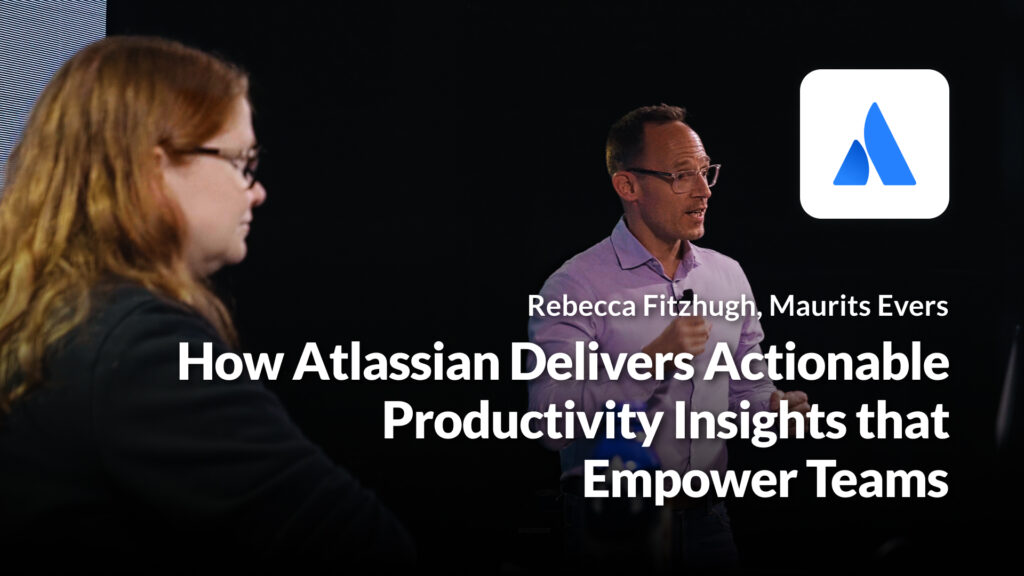
How Atlassian Delivers Actionable Productivity Insights that Empower Teams
Atlassian has invested significant effort in instrumenting, measuring, and learning how its 5000 engineers develop software. We constructed diagnostics (Vital Signs) and a principled approach (5R) to transform data into insights and context-aware recommendations. This session introduces our 5R framework that enables Atlassian to deliver the (R)ight insights to the (R)ight person at the (R)ight time in the (R)ight place to do the (R)ight thing. We will also cover Vital Signs, our diagnostic toolkit for detecting friction and bottlenecks, diagnosing productivity issues, and developing practices that improve the developer experience. Join us to learn how the partnership between Atlassian engineering & data science is used to understand developer productivity and generate actionable insights that help teams sustainably improve their engineering health.
Watch the video
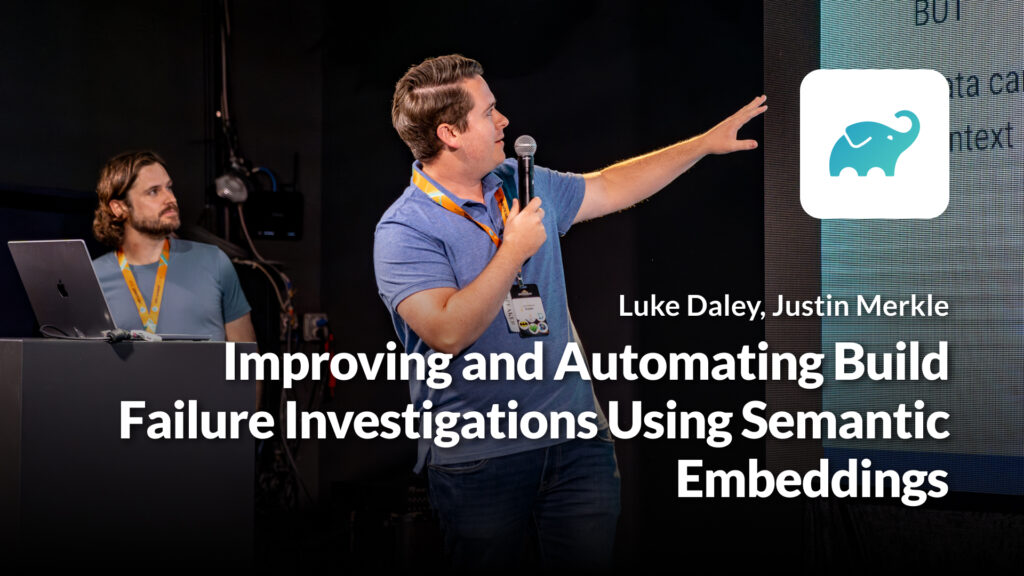
Improving and Automating Build Failure Investigations Using Semantic Embeddings
The process of tracking down and resolving build failures is a big pain point for many software development teams. Developers are often not sure what the actual cause of an observed build failure is, or if the failure they are seeing was caused by their changes or part of a larger problem. Infrastructure teams with several problems to solve often struggle to identify which problems are most impactful and thus should be resolved before others. Answering these questions often requires someone manually sifting through a large amount of available failure messages and log text what the cause of the failure was, which can be ineffective and/or time consuming. There must be a better way to automatically parse through the noise and find the information we’re looking for. At Gradle we have been thinking a lot about how to better approach these problems using modern data science and AI modeling techniques. In this talk we’ll discuss our journey in researching this topic, and how our current methods are being used to improve Developer productivity within our organization.
Watch the video
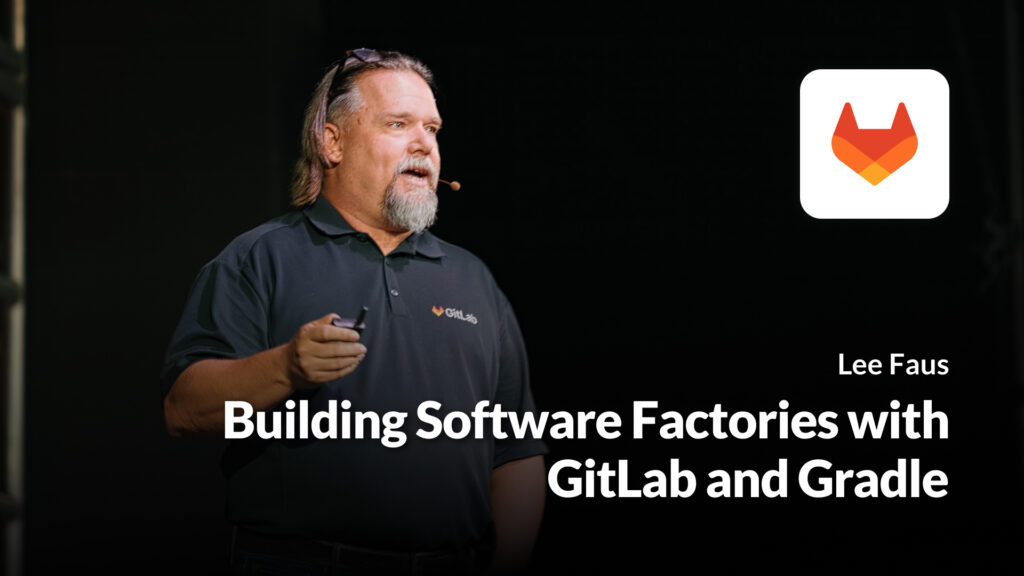
Building Software Factories with GitLab and Gradle
In this lightning talk we will briefly look at the differences between software factories and software logistics and how they map to the overall software supply chain. We will demonstrate how you can use GitLab CI Steps to decompose your Gradle builds to ensure you are collecting the right data about the build before it becomes a package. We will show you how to leverage SemVer to create a production level package across different branching strategies, getting it ready for a deployment to production.
Watch the video
Past, Present, and Future of Developer Productivity Research
Join Abi Noda (CEO of DX) and Margaret-Anne Storey (co-author of DevEx and SPACE, University of Victoria) for a fireside chat that explores the evolution of developer productivity research. They’ll dive into the backstory of DevEx, SPACE, and the just-published DX Core 4—while sharing candid perspectives on current challenges.
Watch the video
2023 Highlights
Check out a collection of top moments from the 2023 Developer Productivity Engineering Summit in San Francisco.
Watch the video
Watch the Sessions
Explore presentation recordings and slides from our 2023 Summit speakers. You can browse them all or filter by topic and company.
Developer Productivity Engineering: Your Unfair Competitive Advantage
Hans explores the knife sharpening industry as a way of thinking about developer productivity—how we measure it and how we move it. He makes the case that for software development, just like for meat processing, collecting data and having the bandwidth and skills to interpret that data and apply learnings is the only way we can truly move the industry forward.
Watch the video
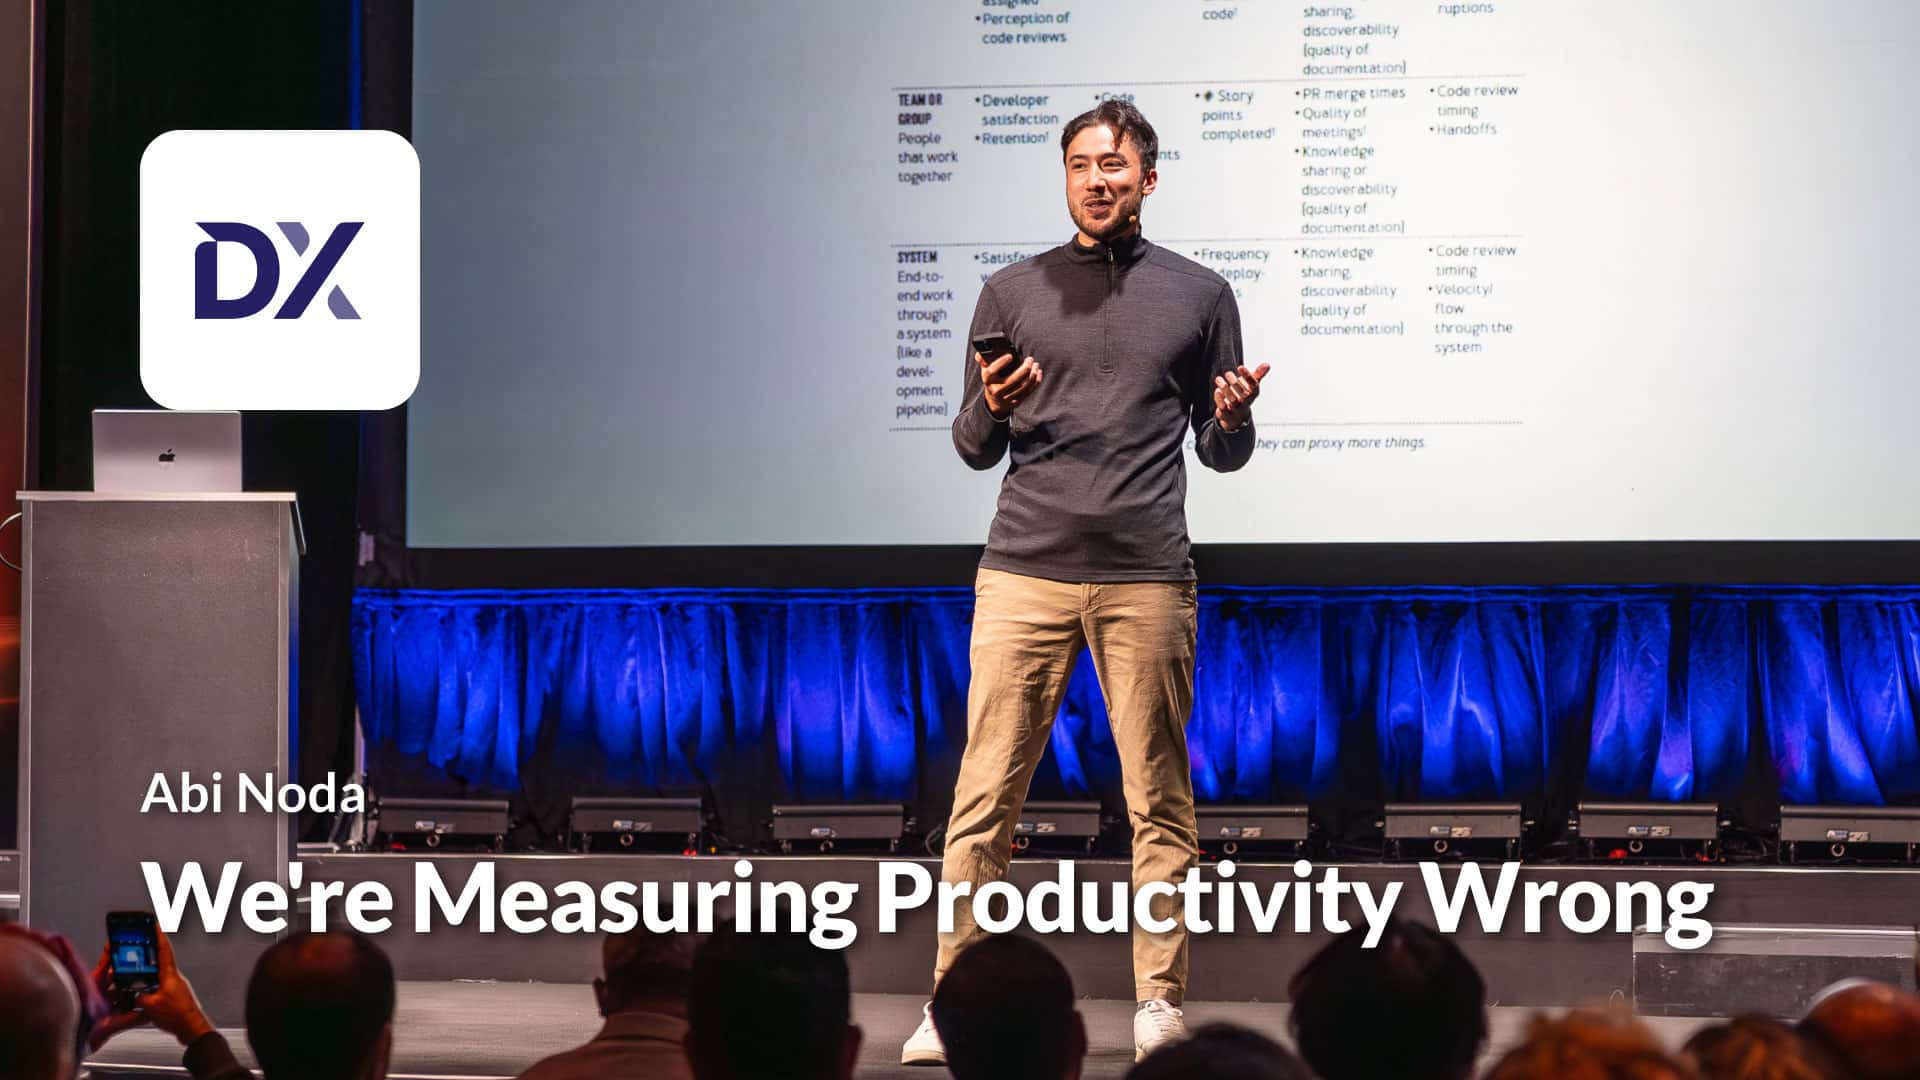
We’re Measuring Productivity Wrong
Abi at DX addresses ongoing challenges in developer productivity that persist despite the last 10-15 years of technological advancement. He emphasizes shifting from traditional metrics to staff-ranked productivity, aligning with outcome-focused DPE principles, and tackling issues like slow builds and context-switching.
Watch the video
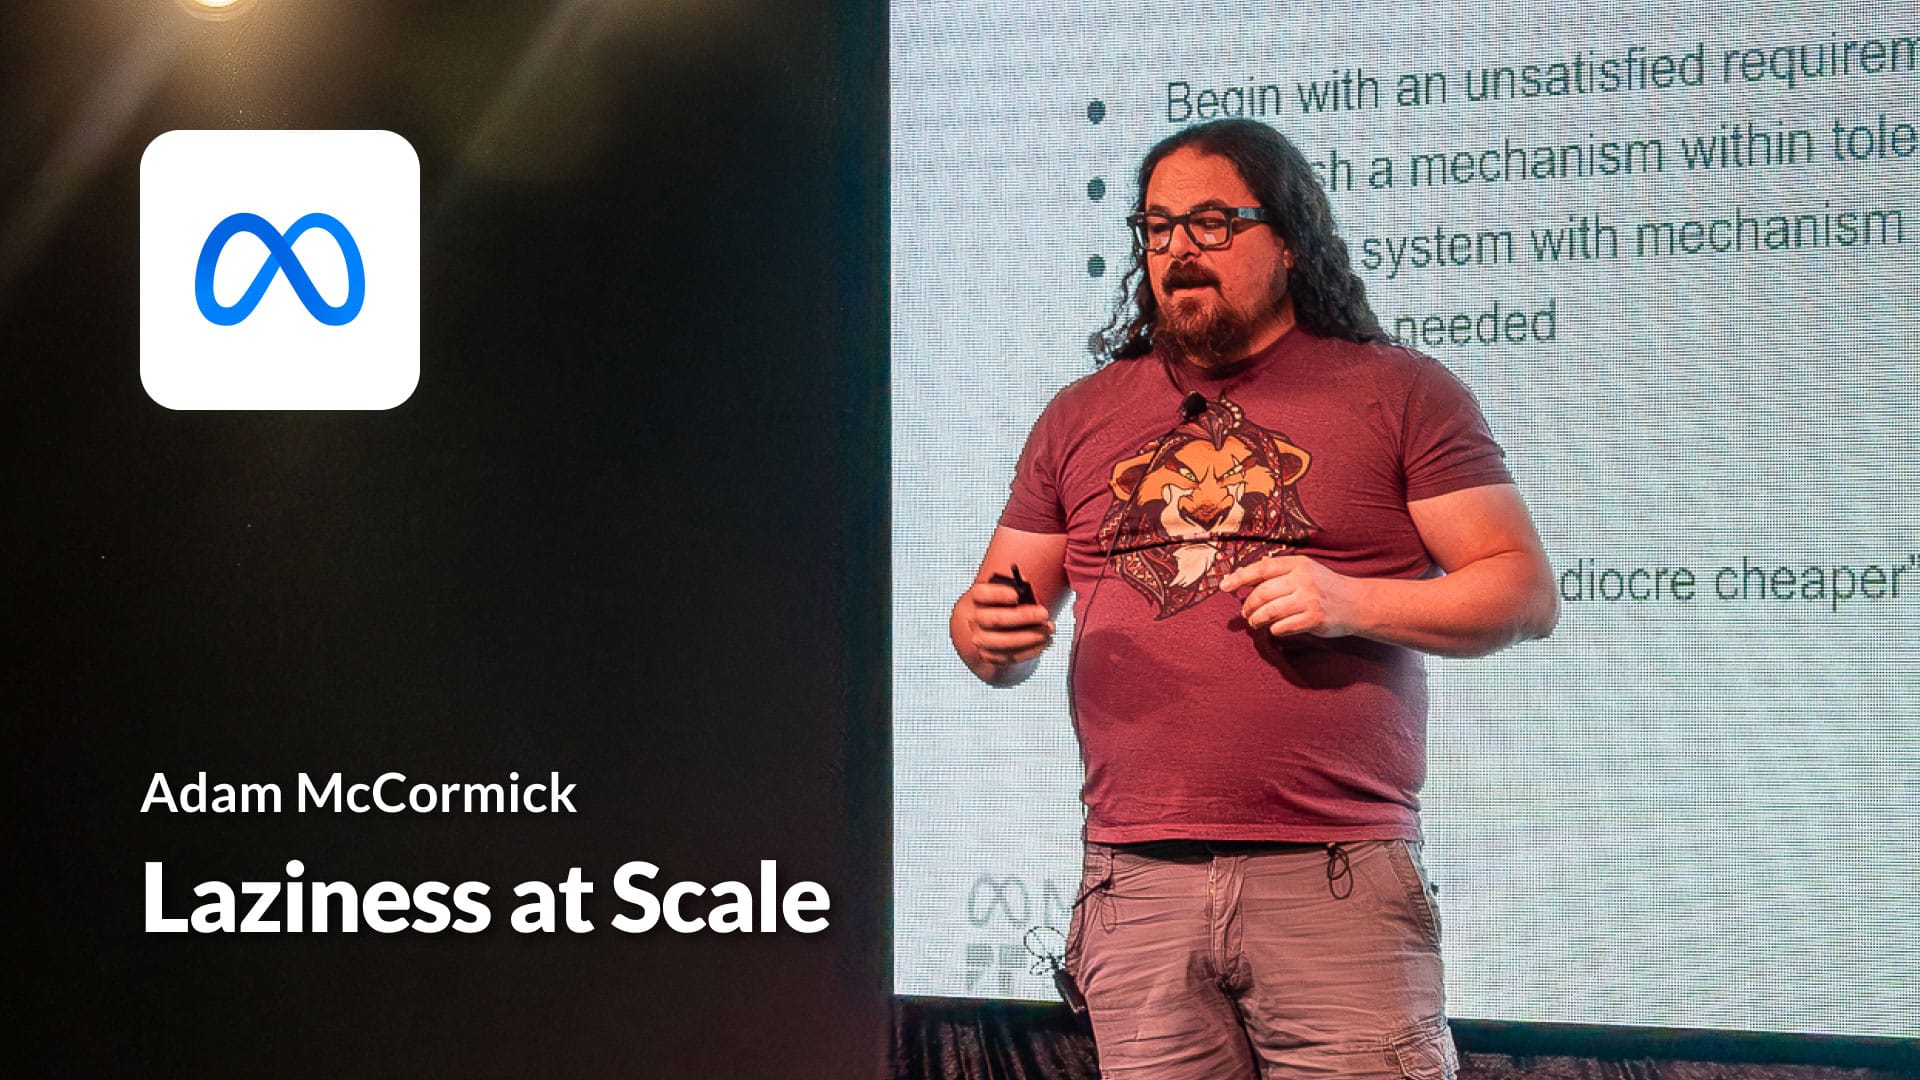
Laziness at Scale
Adam at Meta diverges from the technical aspects of DPE, delving into the role of psychology in decision-making. He analyzes developer and manager characteristics and emphasizes the value of laziness by avoiding unnecessary work (a key DPE principle). Sharing anecdotes, he emphasizes the value of saying “no”, showcases different manager archetypes, and explains how to enhance personal productivity for organizational recognition.
Watch the video
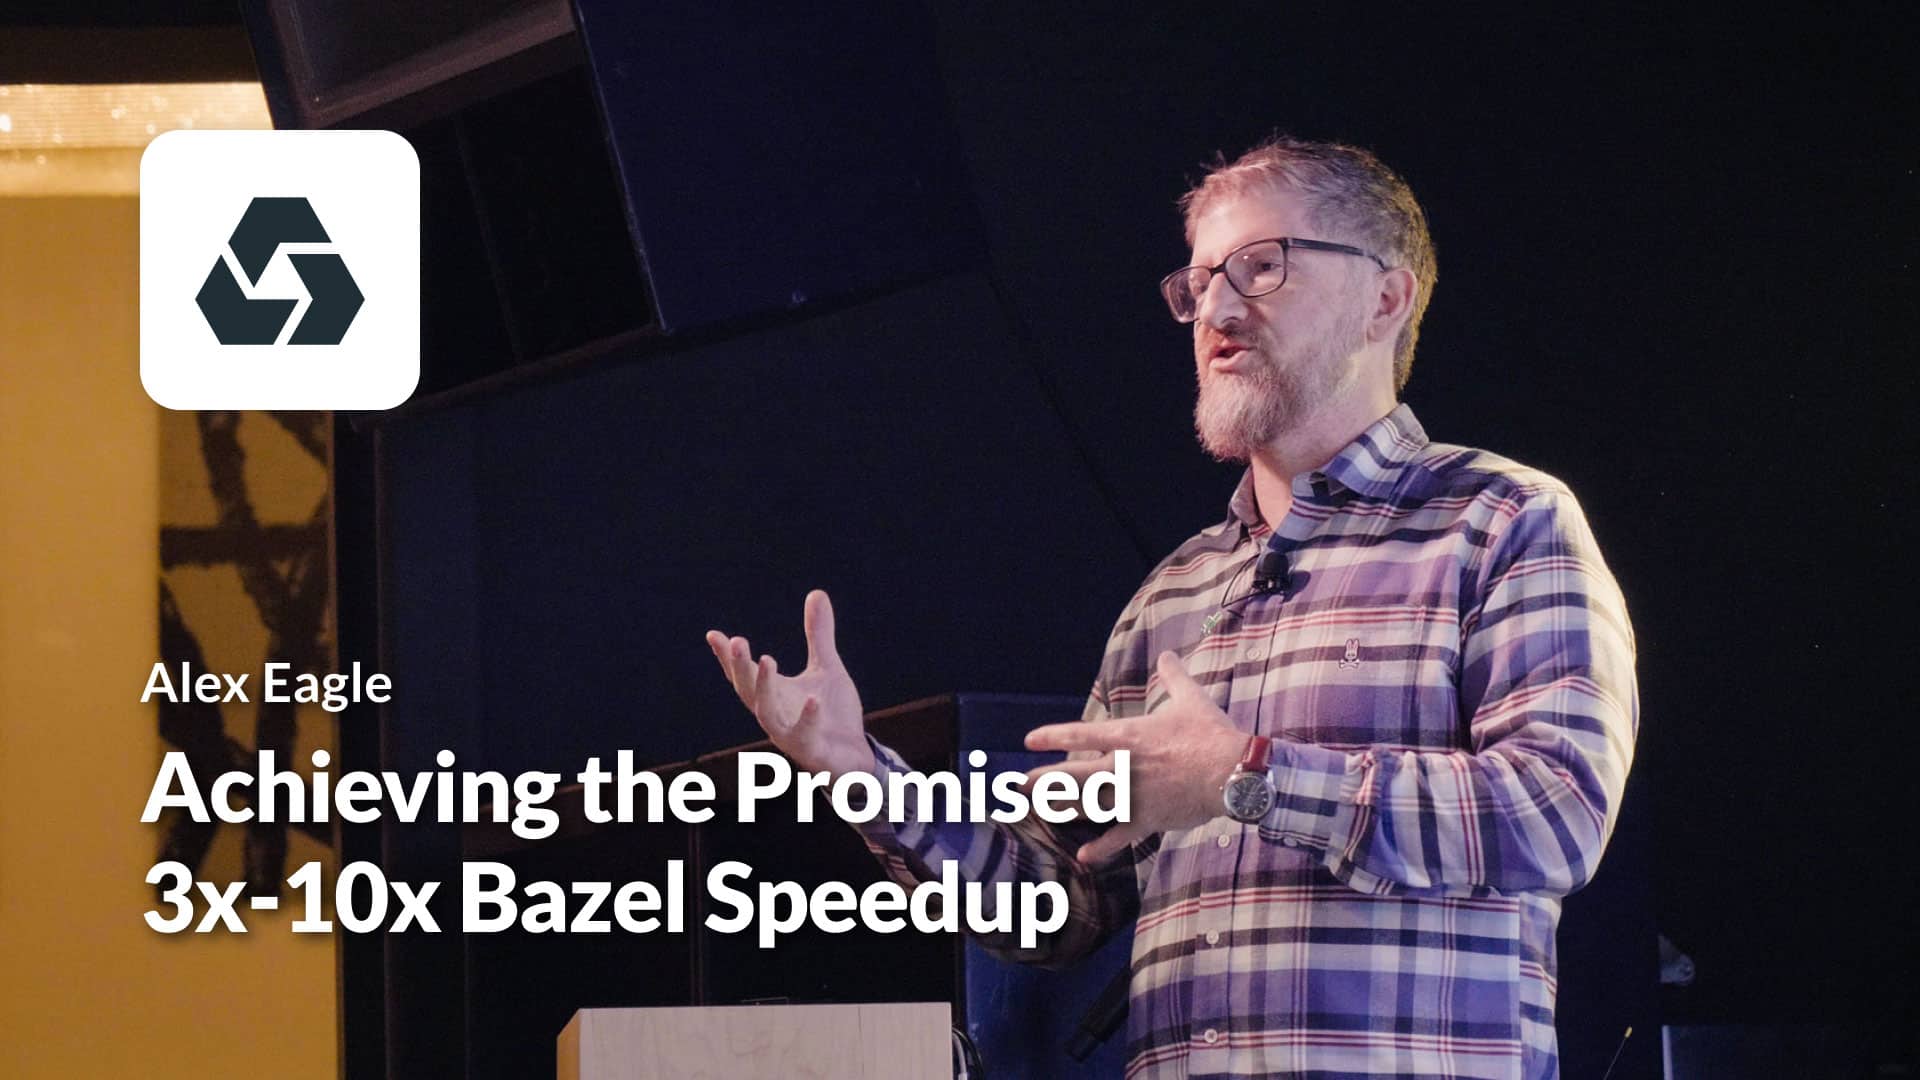
Achieving the Promised 3x-10x Bazel Speedup
Alex at Aspect looks into the first Bazel users who reported 3-10x speed-ups. Who are they? It turns out most users didn’t experience this out of the box. His talk touches on specific optimization aspects of increasing developer productivity with Bazel, including non-persistent workers, low cache hit rates, network and cluster issues, and the dark side of remote execution.
Watch the video
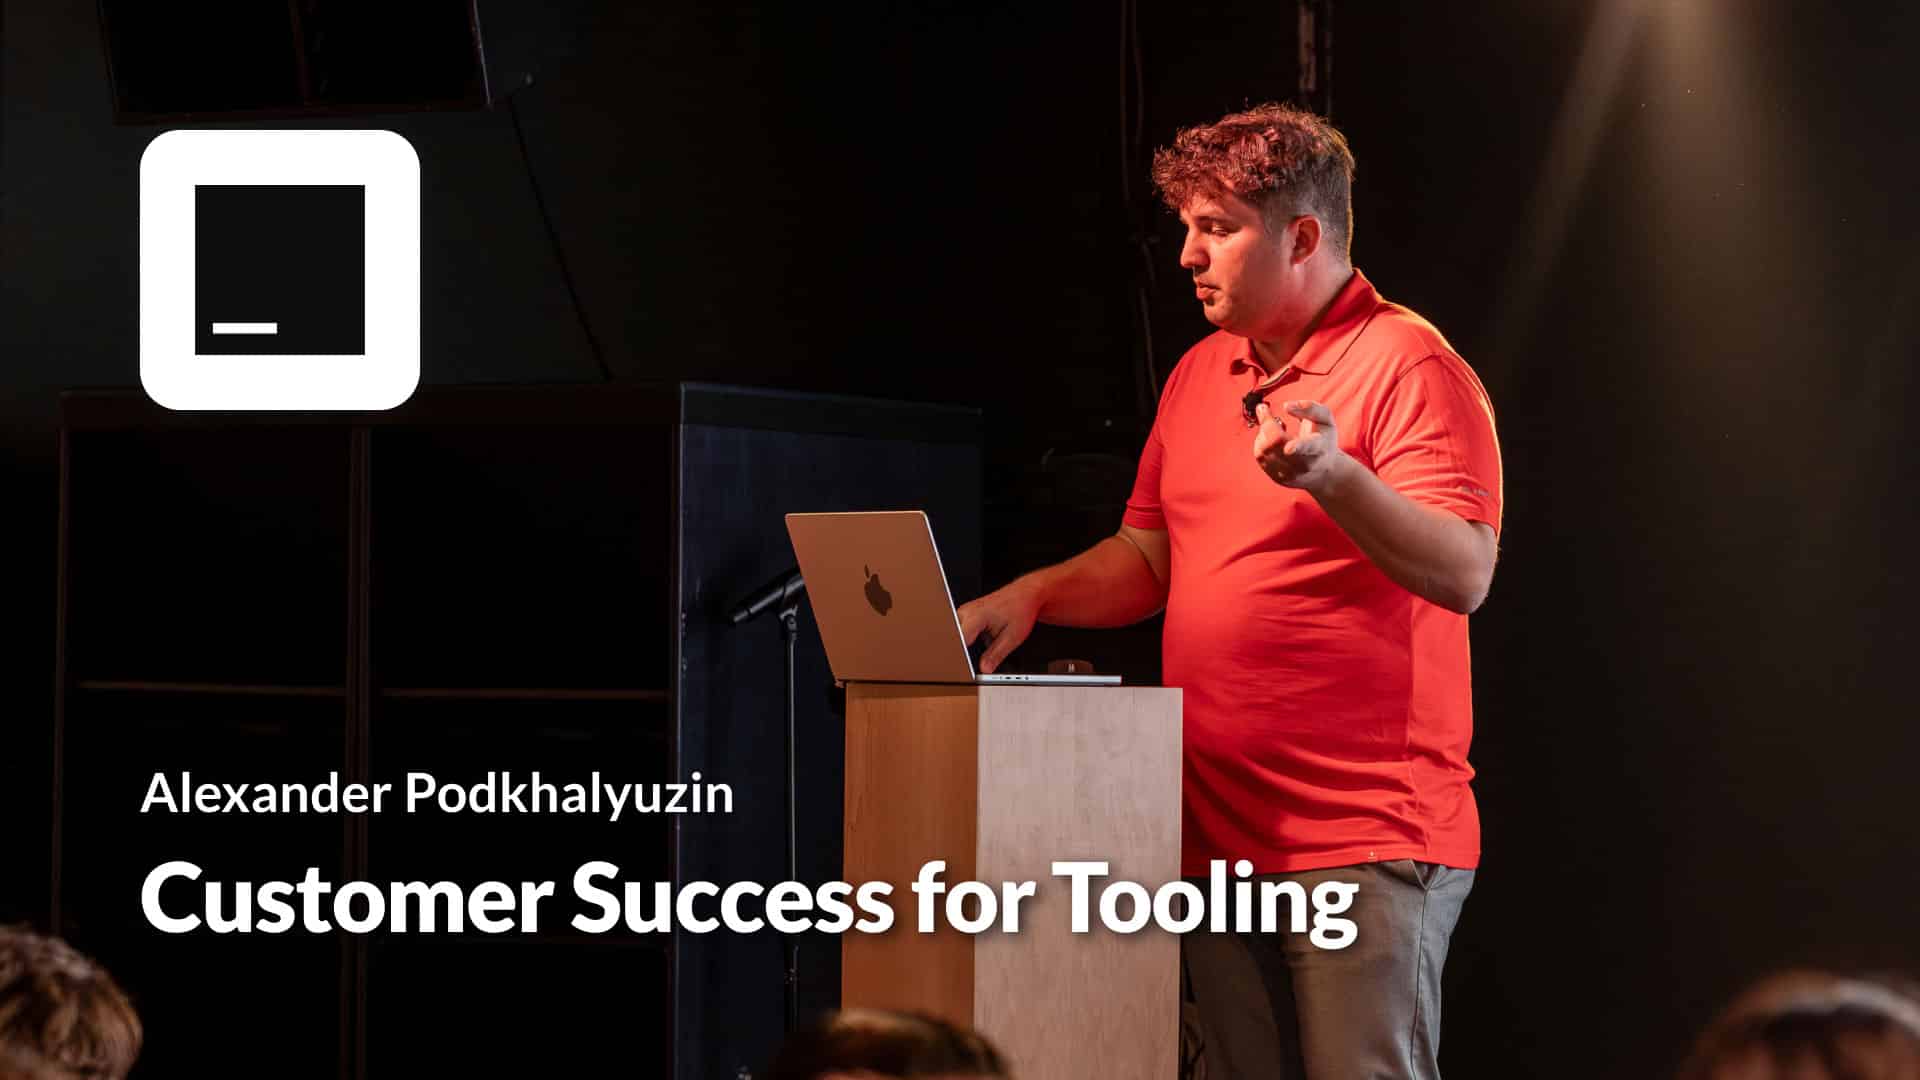
Customer Success for Tooling
Alexander at JetBrains highlights the importance of partnerships when it comes to customer success—he focuses on building trust and transparency and using surveys and data to make incremental improvements to their offerings. JetBrains and DPE both rely on partnerships for success, while emphasizing the key drivers of transparency, communication, and data-driven decision-making.
Watch the video
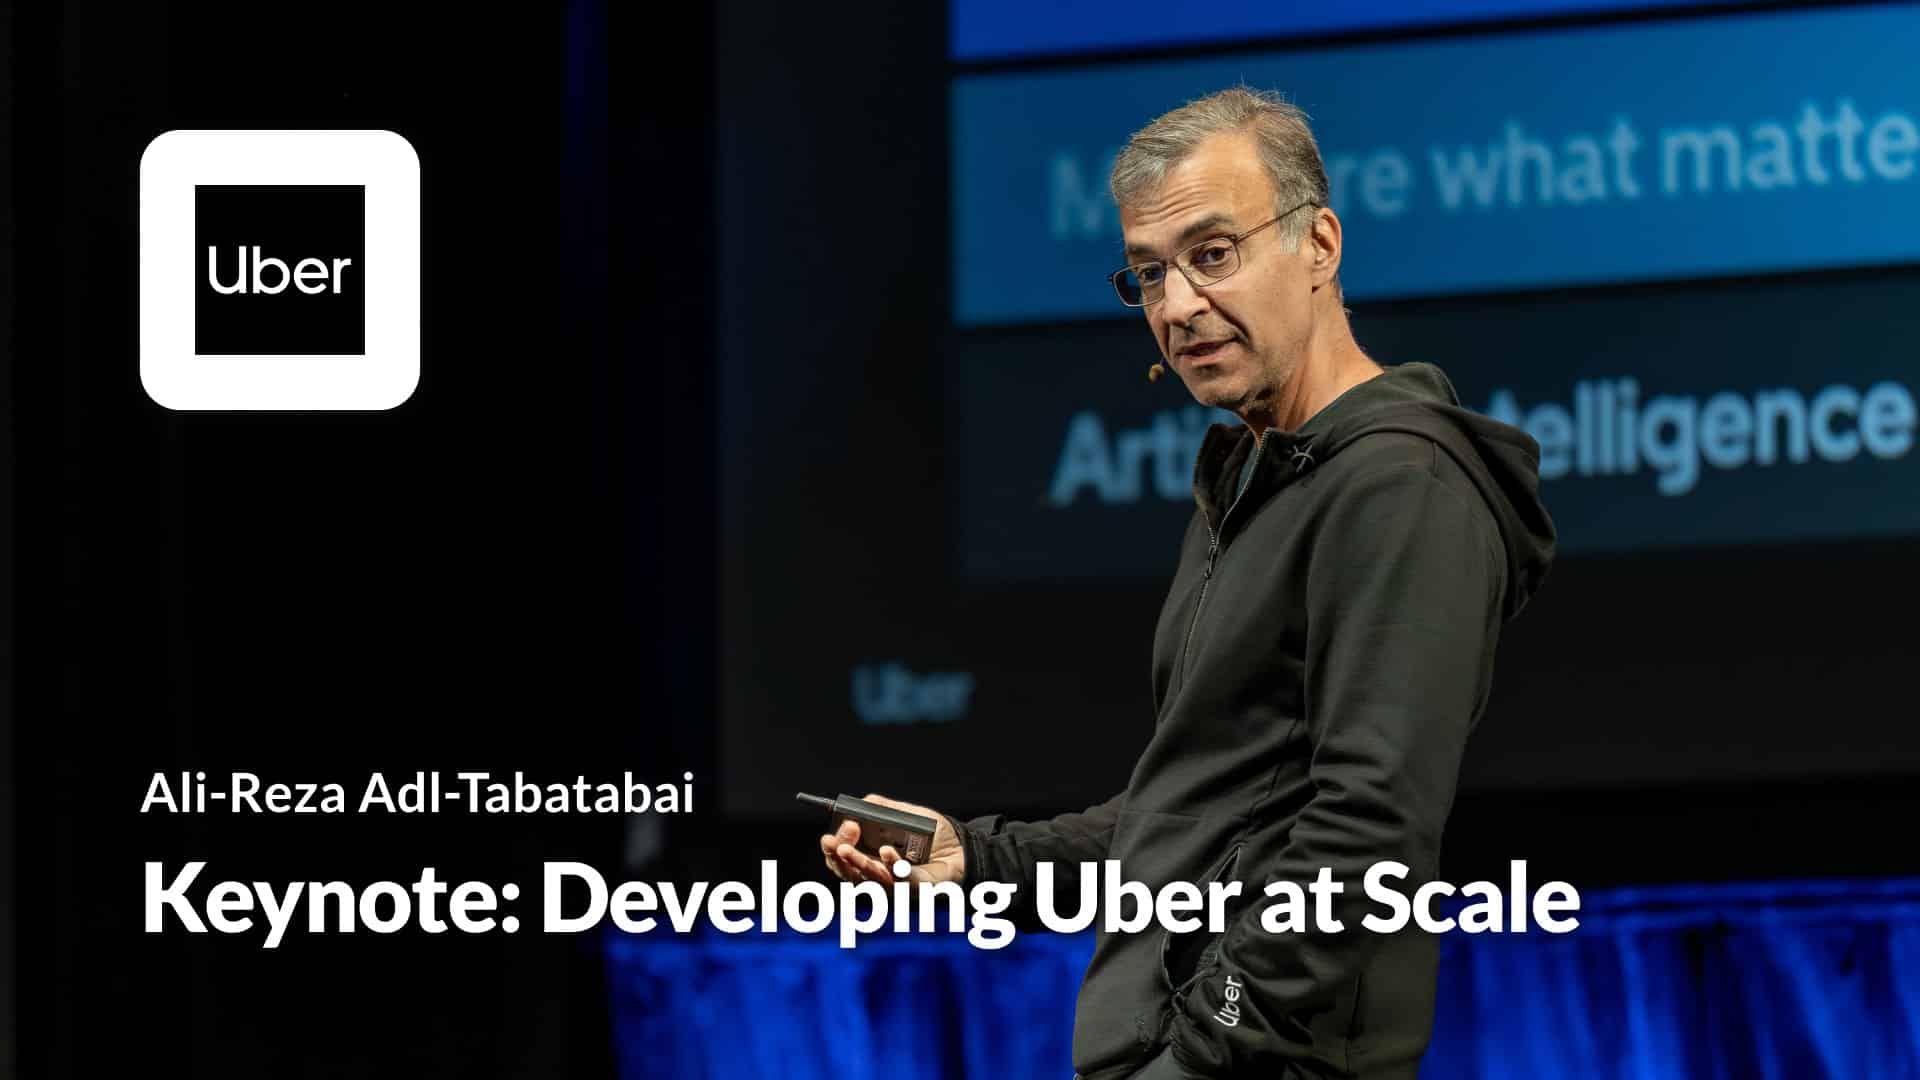
Developing at Uber Scale
Ali from Uber describes how their 200-person Developer Platform team drives efficiency across 100k+ monthly deployments while prioritizing developer satisfaction. Ali’s keynote stresses the significance of DPE tools—like performance acceleration technologies for faster feedback cycles and ML-driven automated testing for driver-rider interactions—showcasing its universal benefits, even for companies not at Uber’s scale.
Watch the video
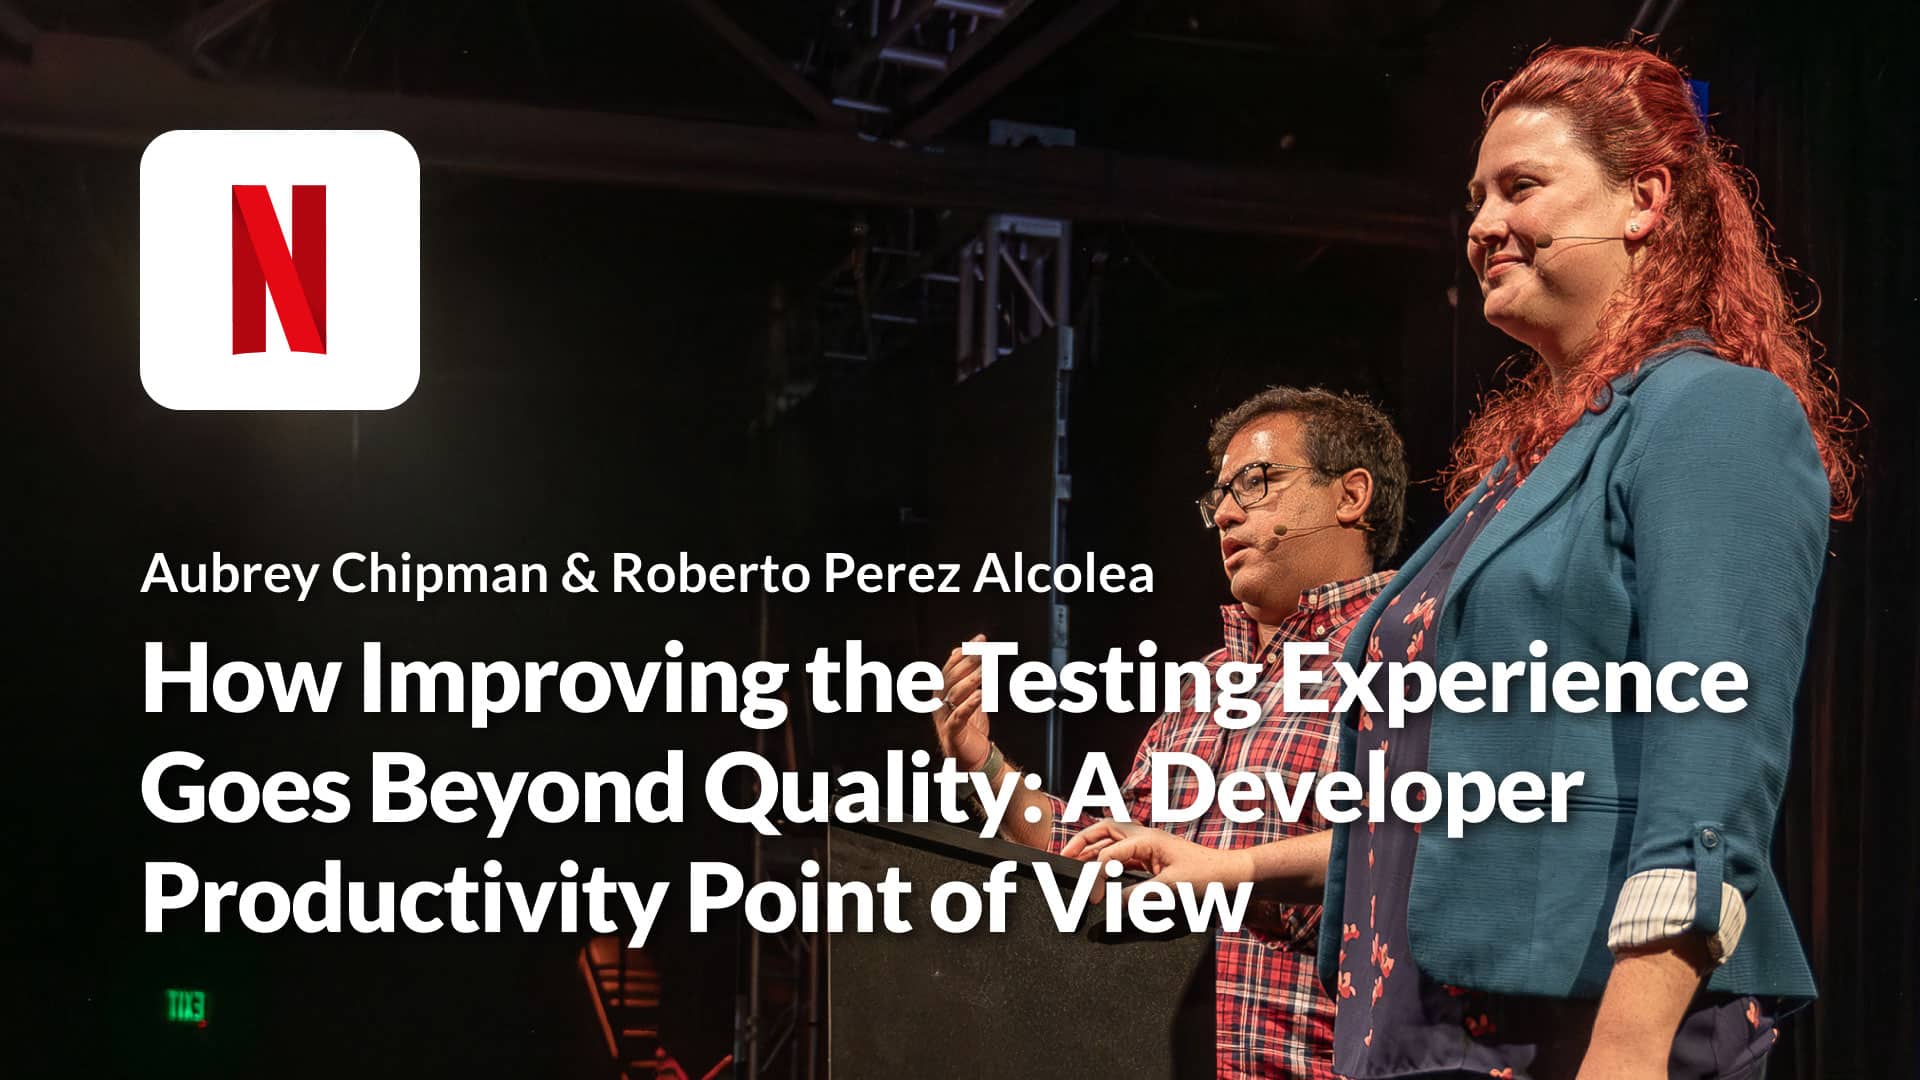
How Improving the Testing Experience Goes Beyond Quality: A Developer Productivity Point of View
If you’re interested in faster tests, flaky test detection/remediation, remote test execution, and predictive test selection, this talk is for you. Pro Tip: How they rolled out Develocity’s Predictive Test Selection AI/ML technology to save 107 days of test execution time in the first month is quite interesting.
Watch the video
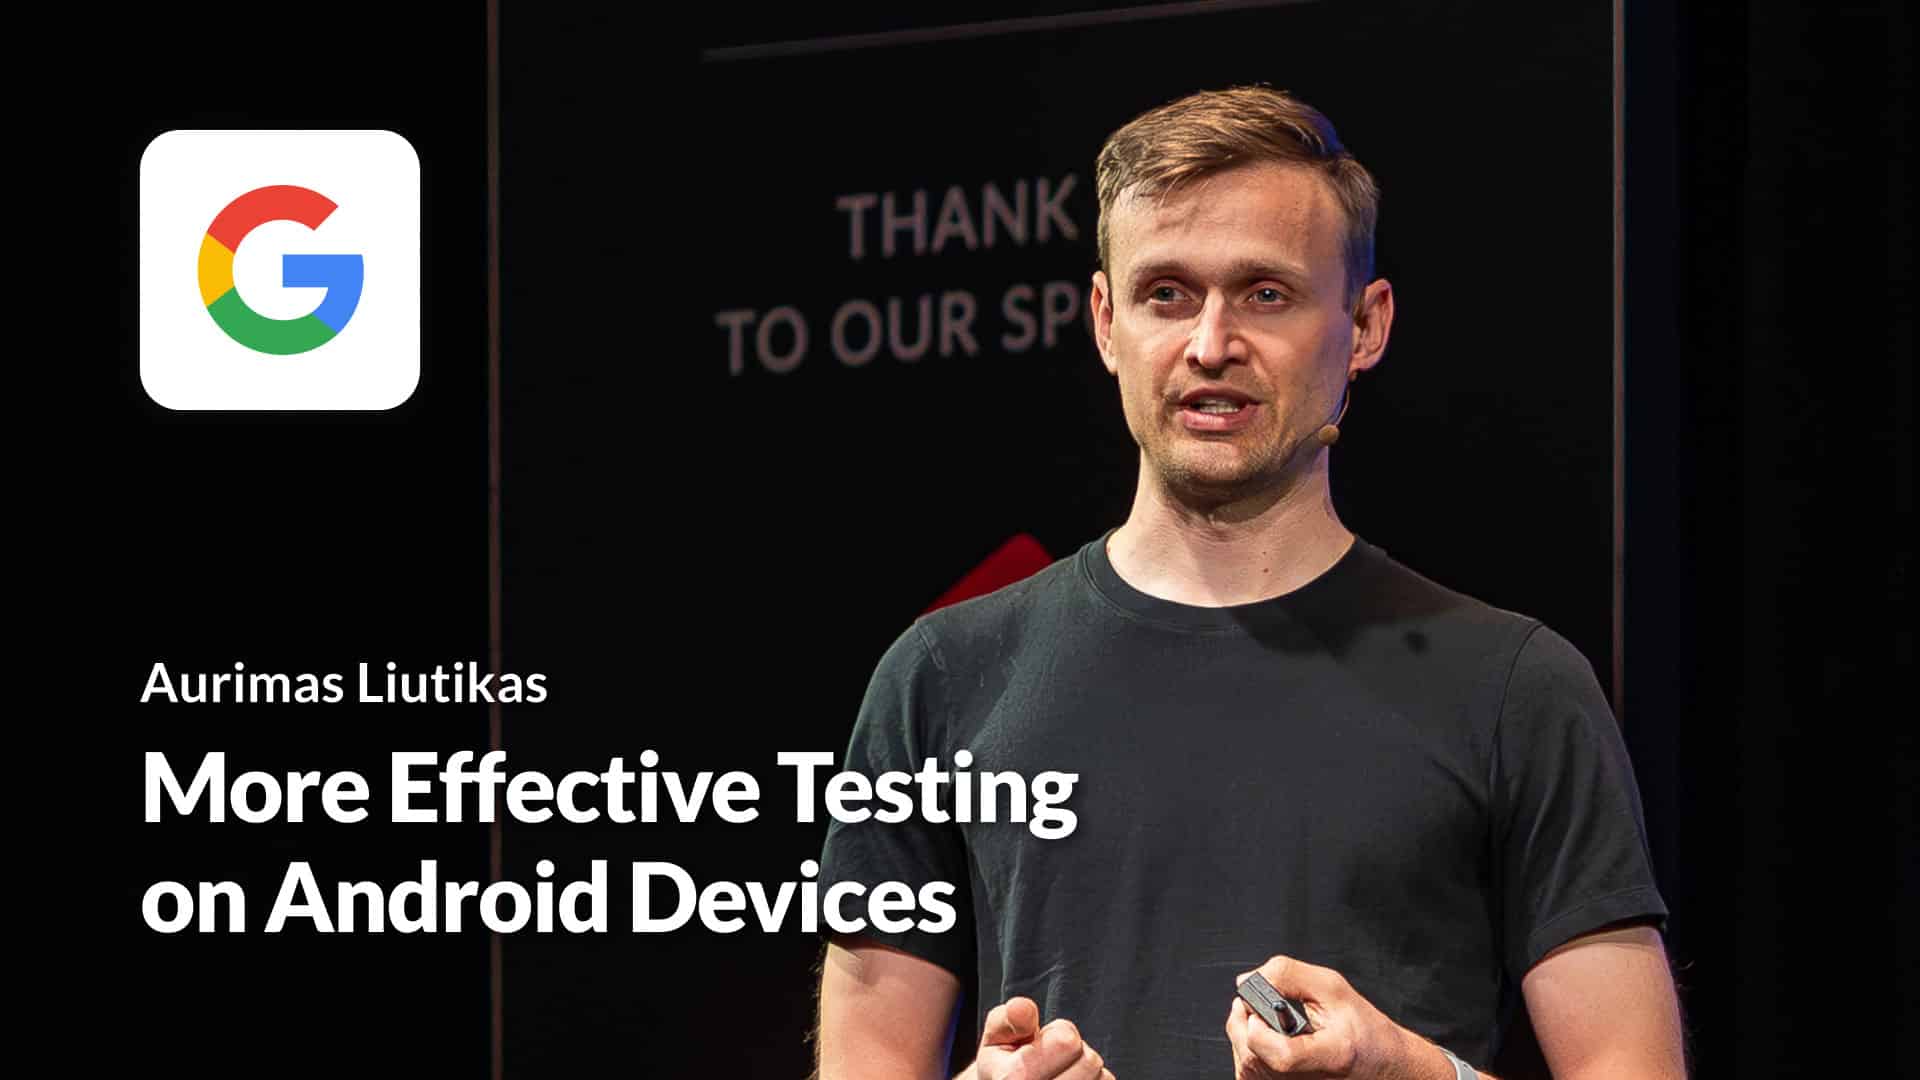
More Effective Testing on Android Devices
Aurimas shares his Android on-device testing tips, including what you should avoid to run more effective tests. He shares the AndroidX case study that covers to how to keep their continuously growing test suite fast.
Watch the video
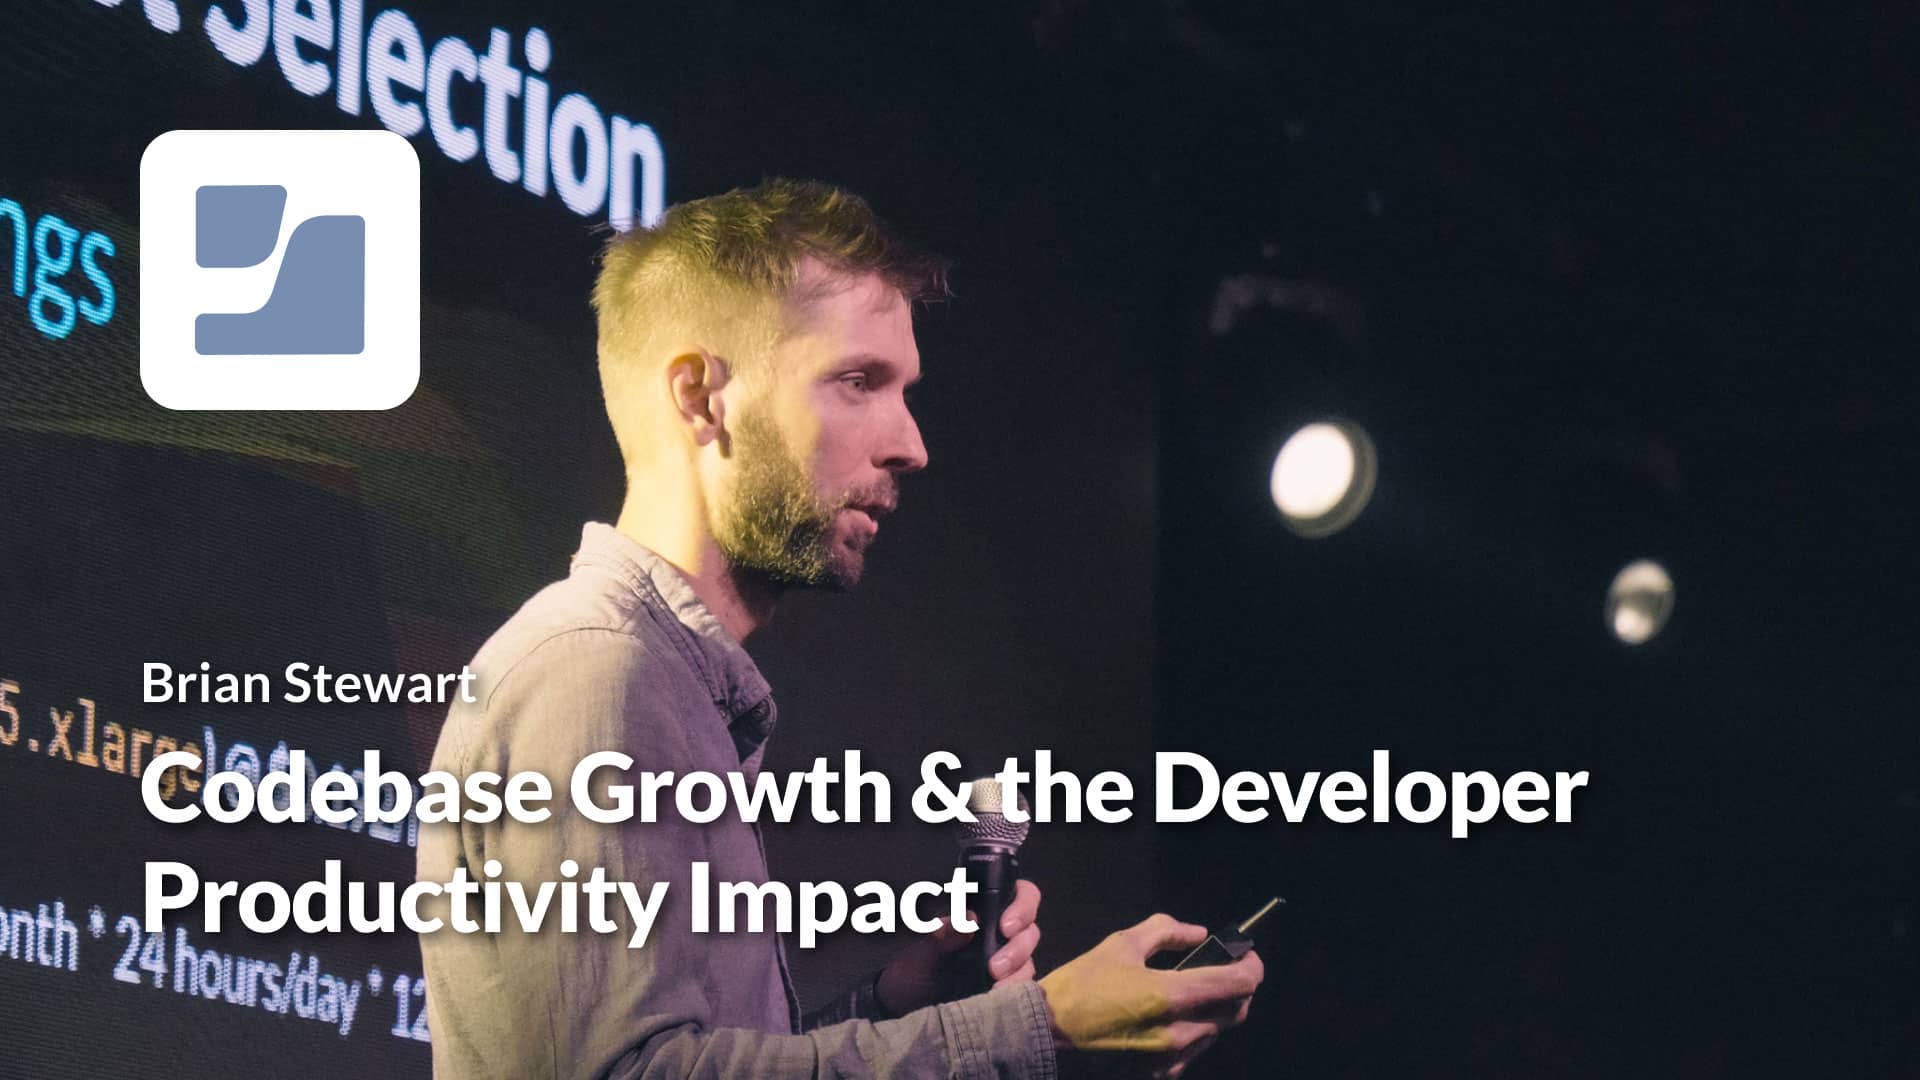
Codebase Growth and the Developer Productivity Impact
Brian from the Jamf DPE team shares how he measured the impact of codebase growth on build times and developer productivity. Brian also shares how Develocity’s Predictive Test Selection reduced unit test time by 36% and integration test time by 39%. If you’re interested in build/test performance acceleration, this talk is for you.
Watch the video
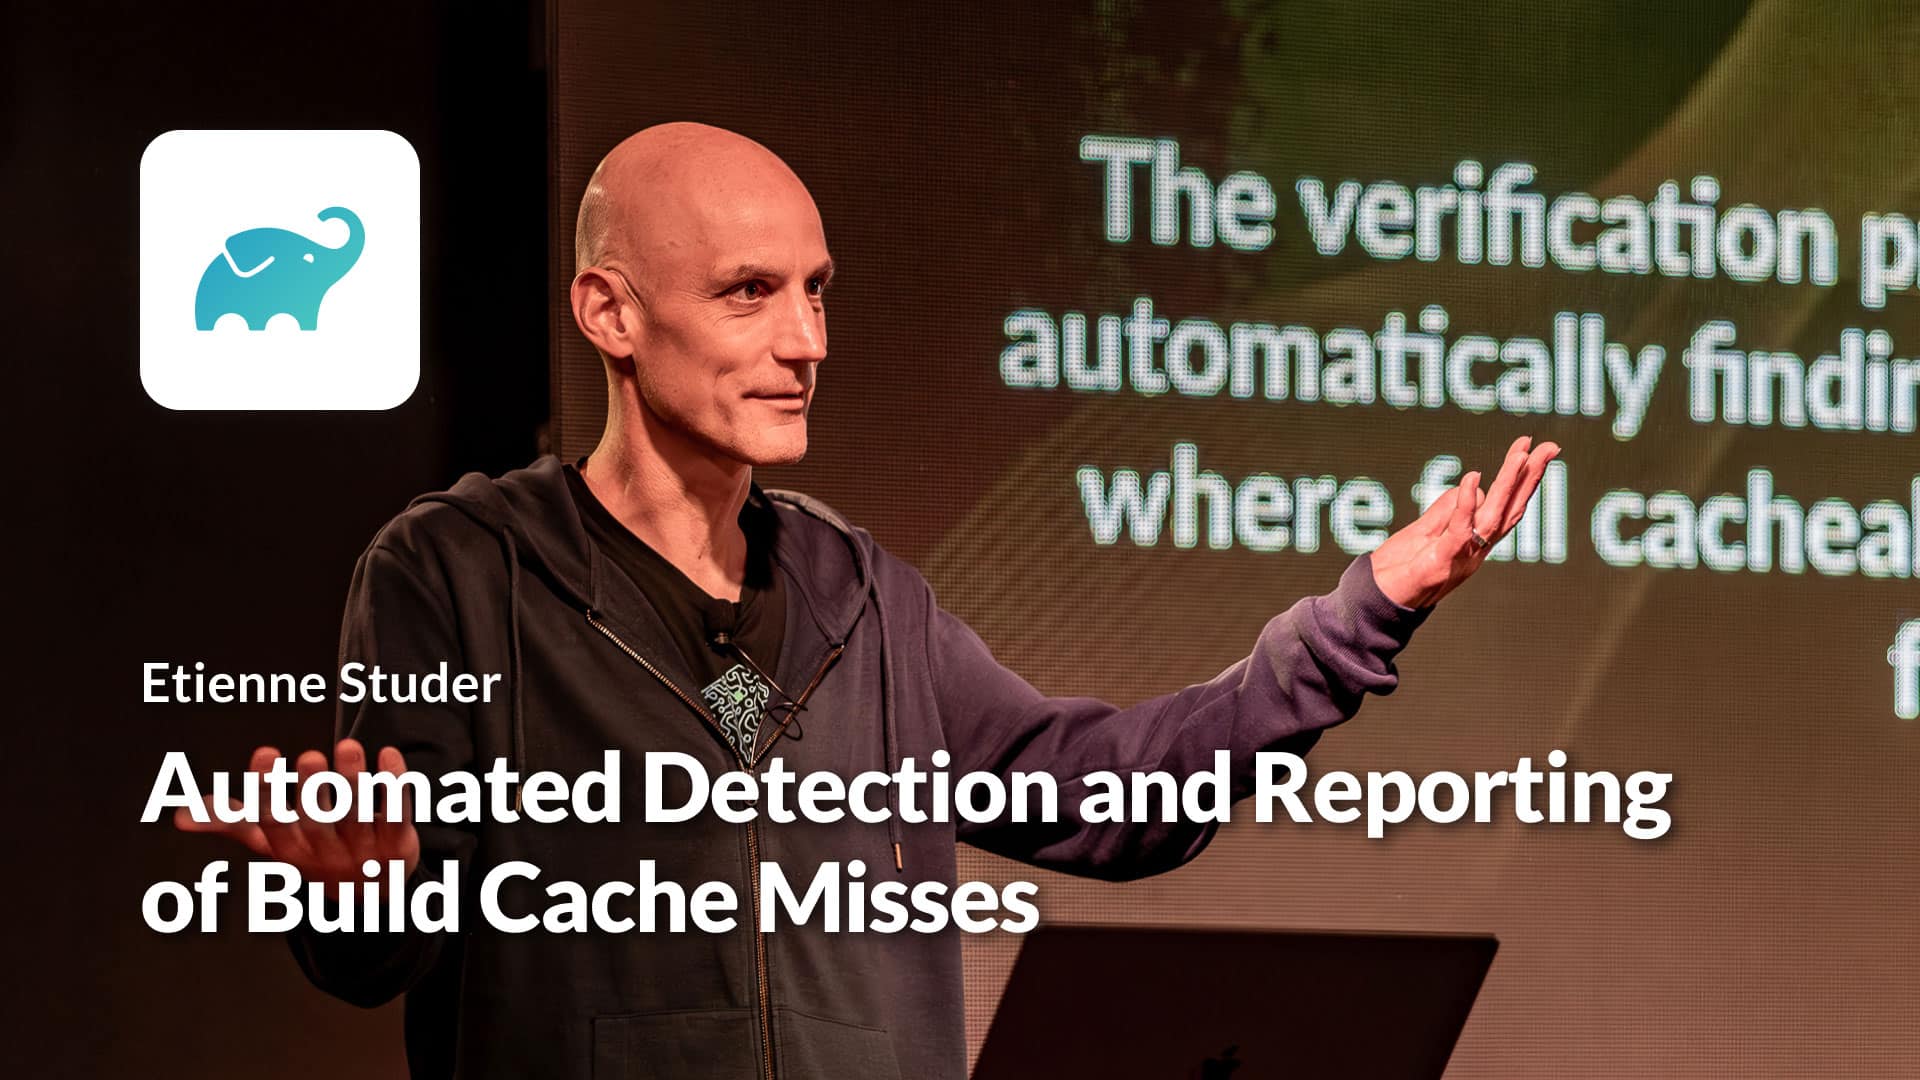
Automated Detection and Reporting of Build Cache Misses
Etienne from the Develocity (formerly Gradle Enterprise) engineering team shares how you can use the latest Develocity build/test observability feature—build validation scripts—to monitor build cache misses across many projects. You can identify which of your projects had build cache misses, the number of misses, and the amount of engineering time lost. He also explains how to generate a fast link to the Build Scan UI to investigate and fix problems.
Watch the video
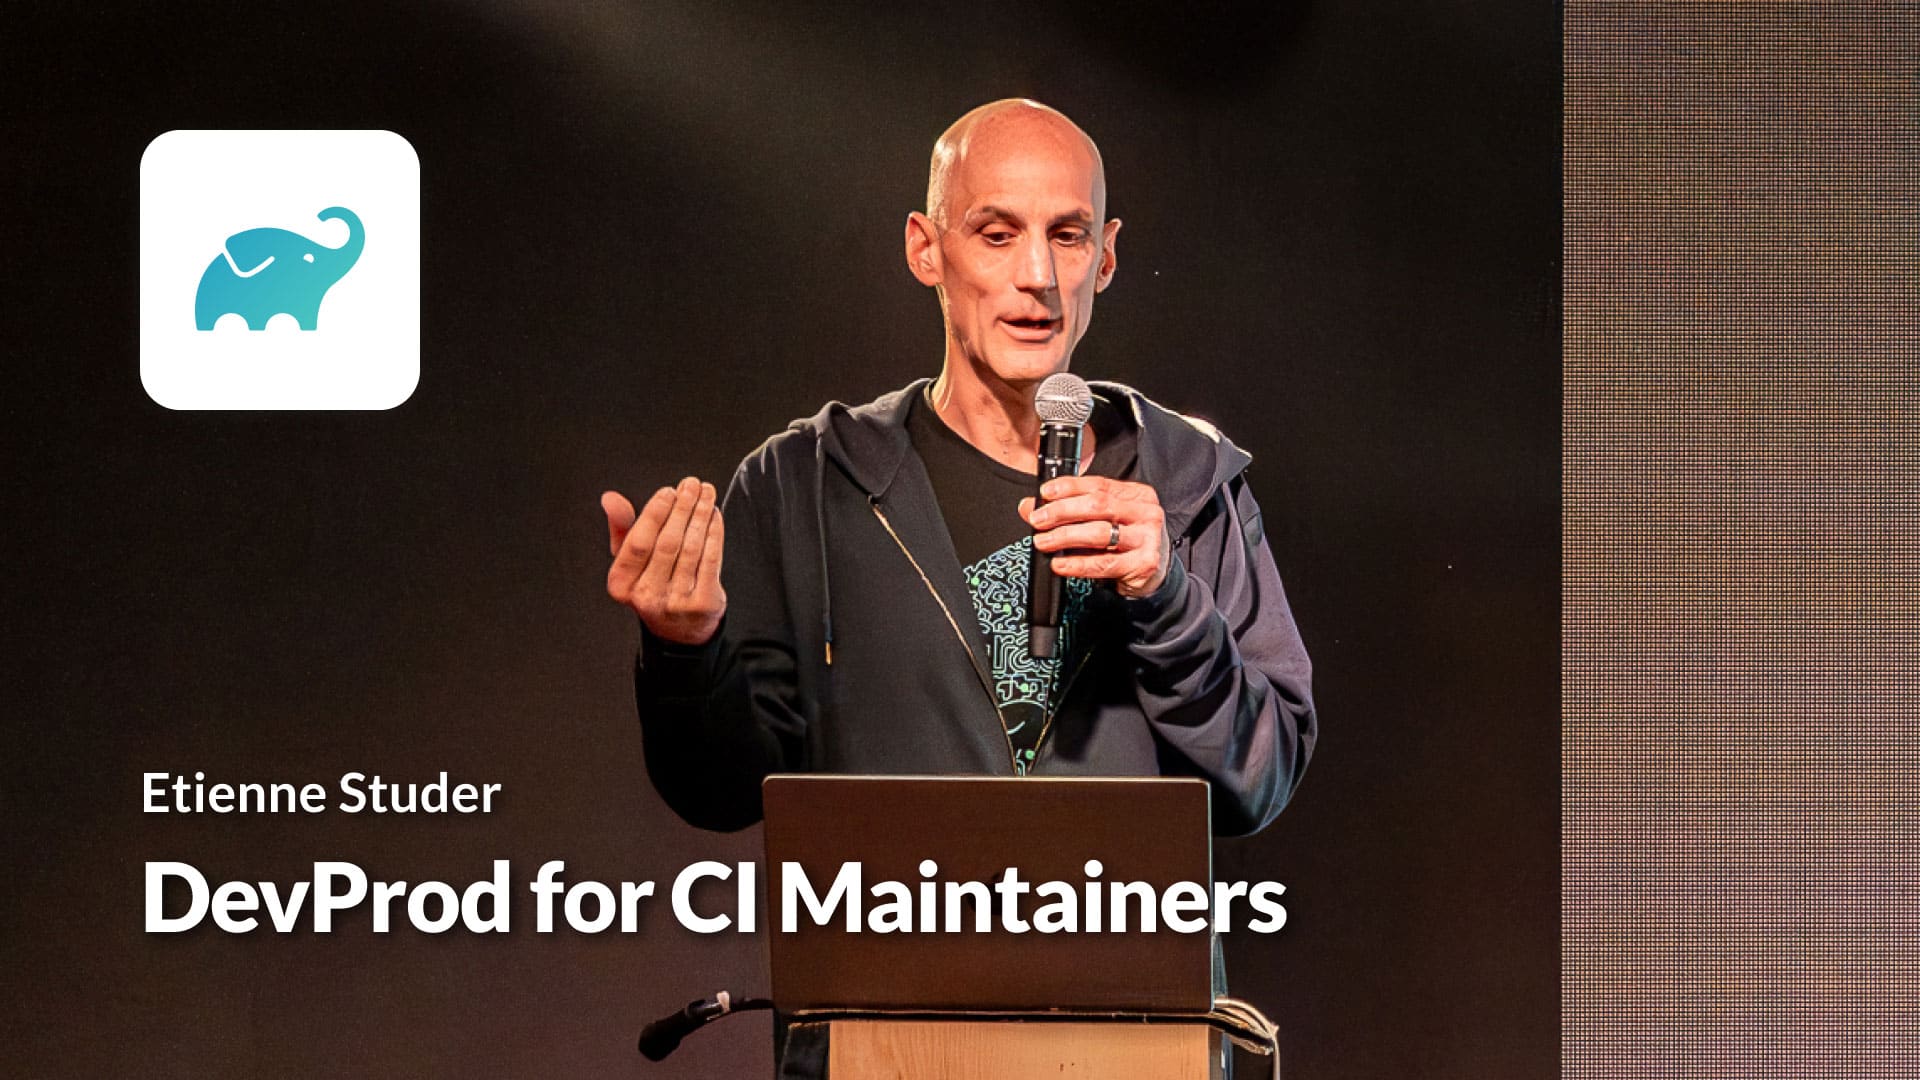
DevProd for CI Maintainers
Etienne from the Develocity (formerly Gradle Enterprise) engineering team shows how you can use Develocity to capture CI build/test data from many projects to identify productivity bottlenecks. He shares how to use the Develocity telemetry and API data to surface and prioritize DPE initiatives. Pro tip: If you’re interested in DPE build/test metrics, query and visualization with AWS Athena and Grafana is quite interesting.
Watch the video
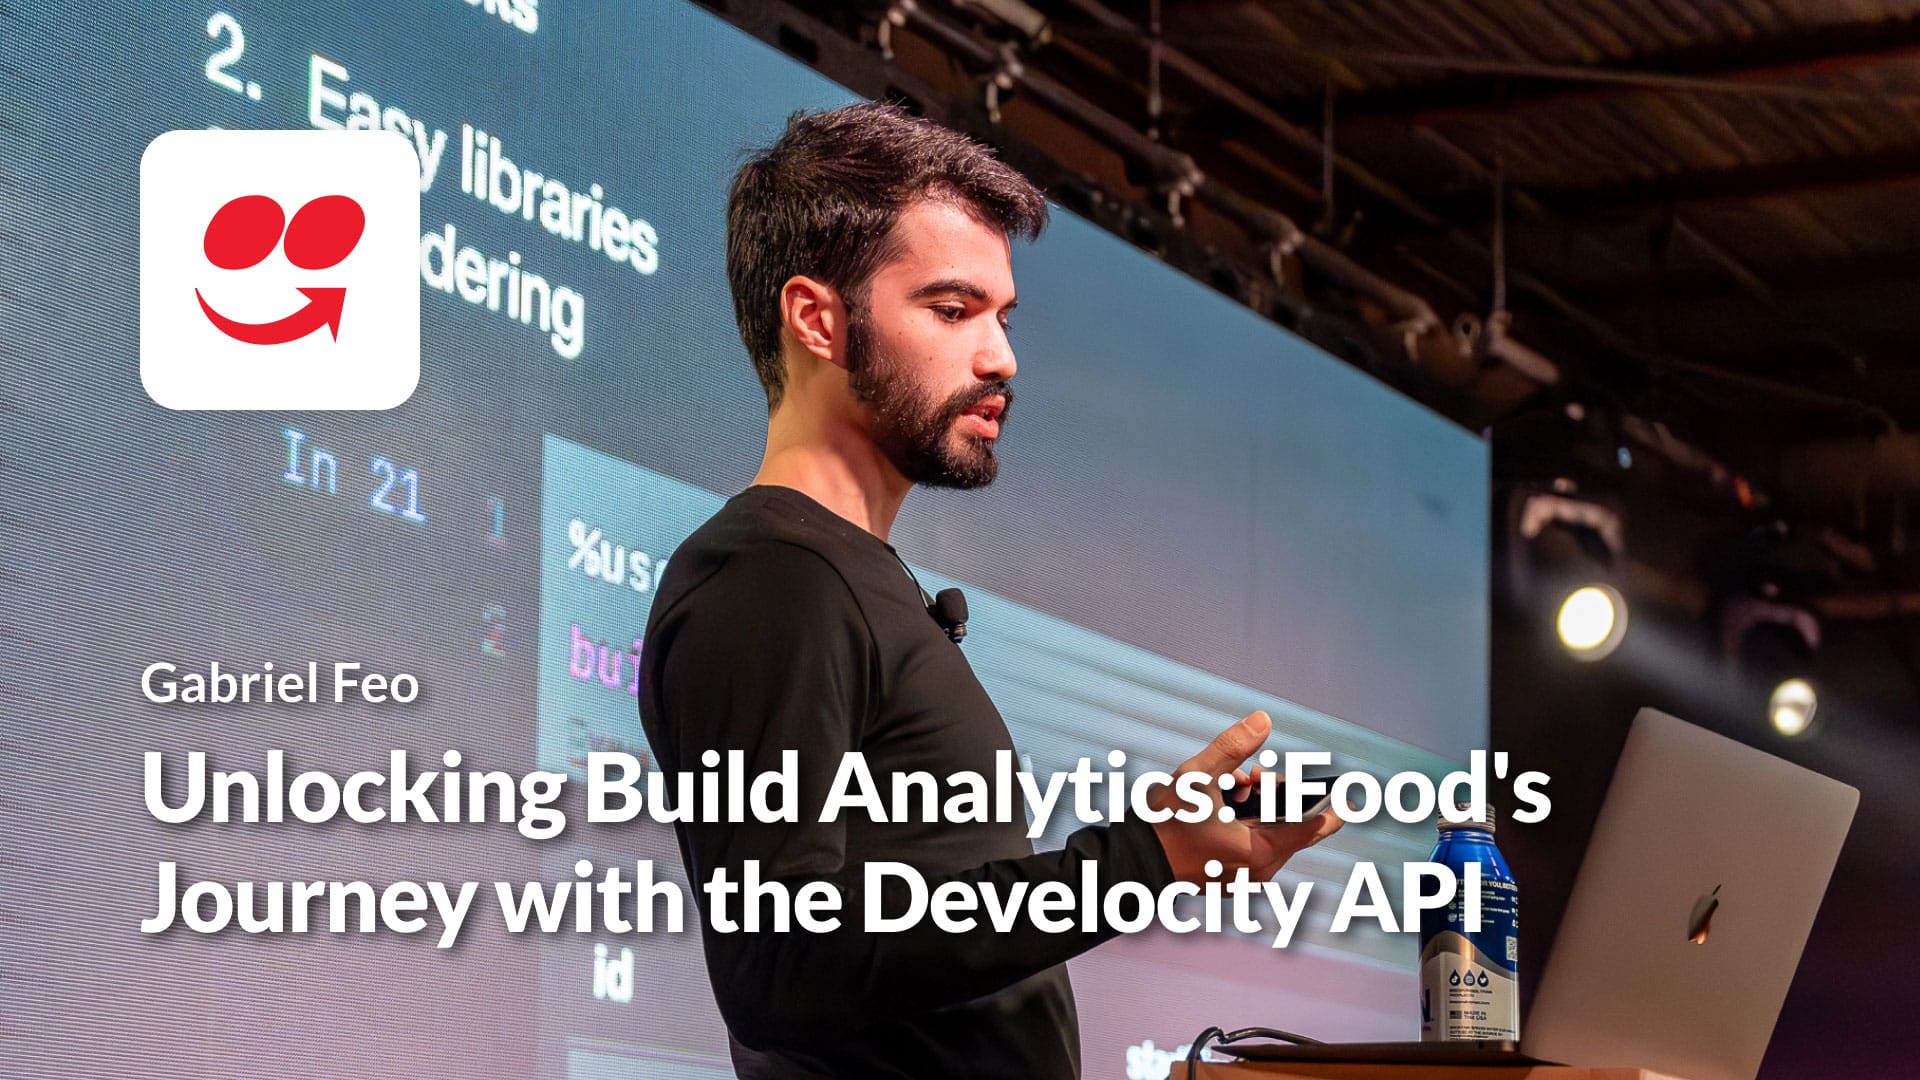
Unlocking Build Analytics: iFood’s Journey with the Gradle Enterprise API
Gabriel from iFood shares how they used the Develocity API to capture build/test metrics across their projects and builds. They used these metrics to create reports and dashboards to monitor flaky tests, and then used the insights to get aggregate reports around hard-to-find bottlenecks. How they use the Devolocity API for monitoring flaky tests and automating the creation of test tickets is pretty cool.
Watch the video
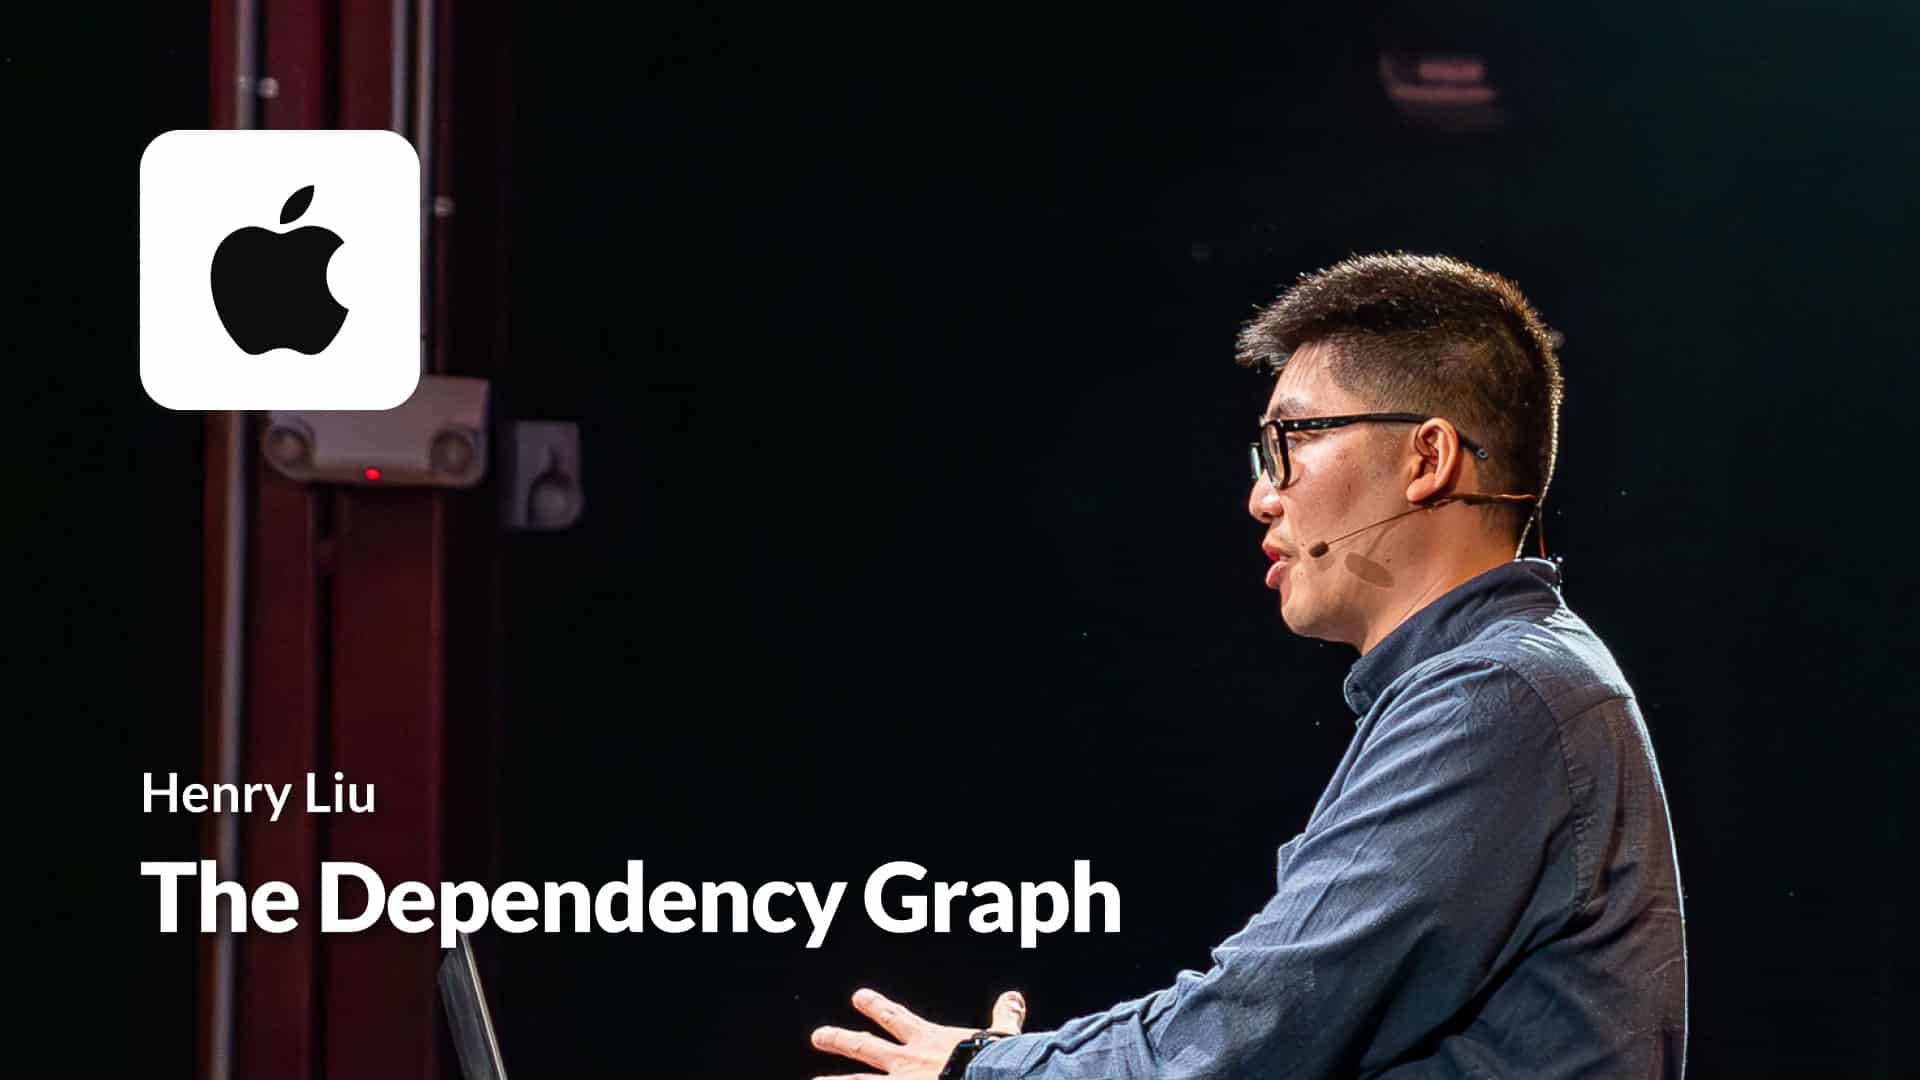
The Dependency Graph
Henry from the Apple Maps team shares how they solve dependency hell, at scale. If you’re interested in SBOM (software bill of materials), Dependency analysis/graphs, and DPE for microservices, this is the talk for you. Pro Tip: The automated dependency updates across many projects is especially interesting.
Watch the video
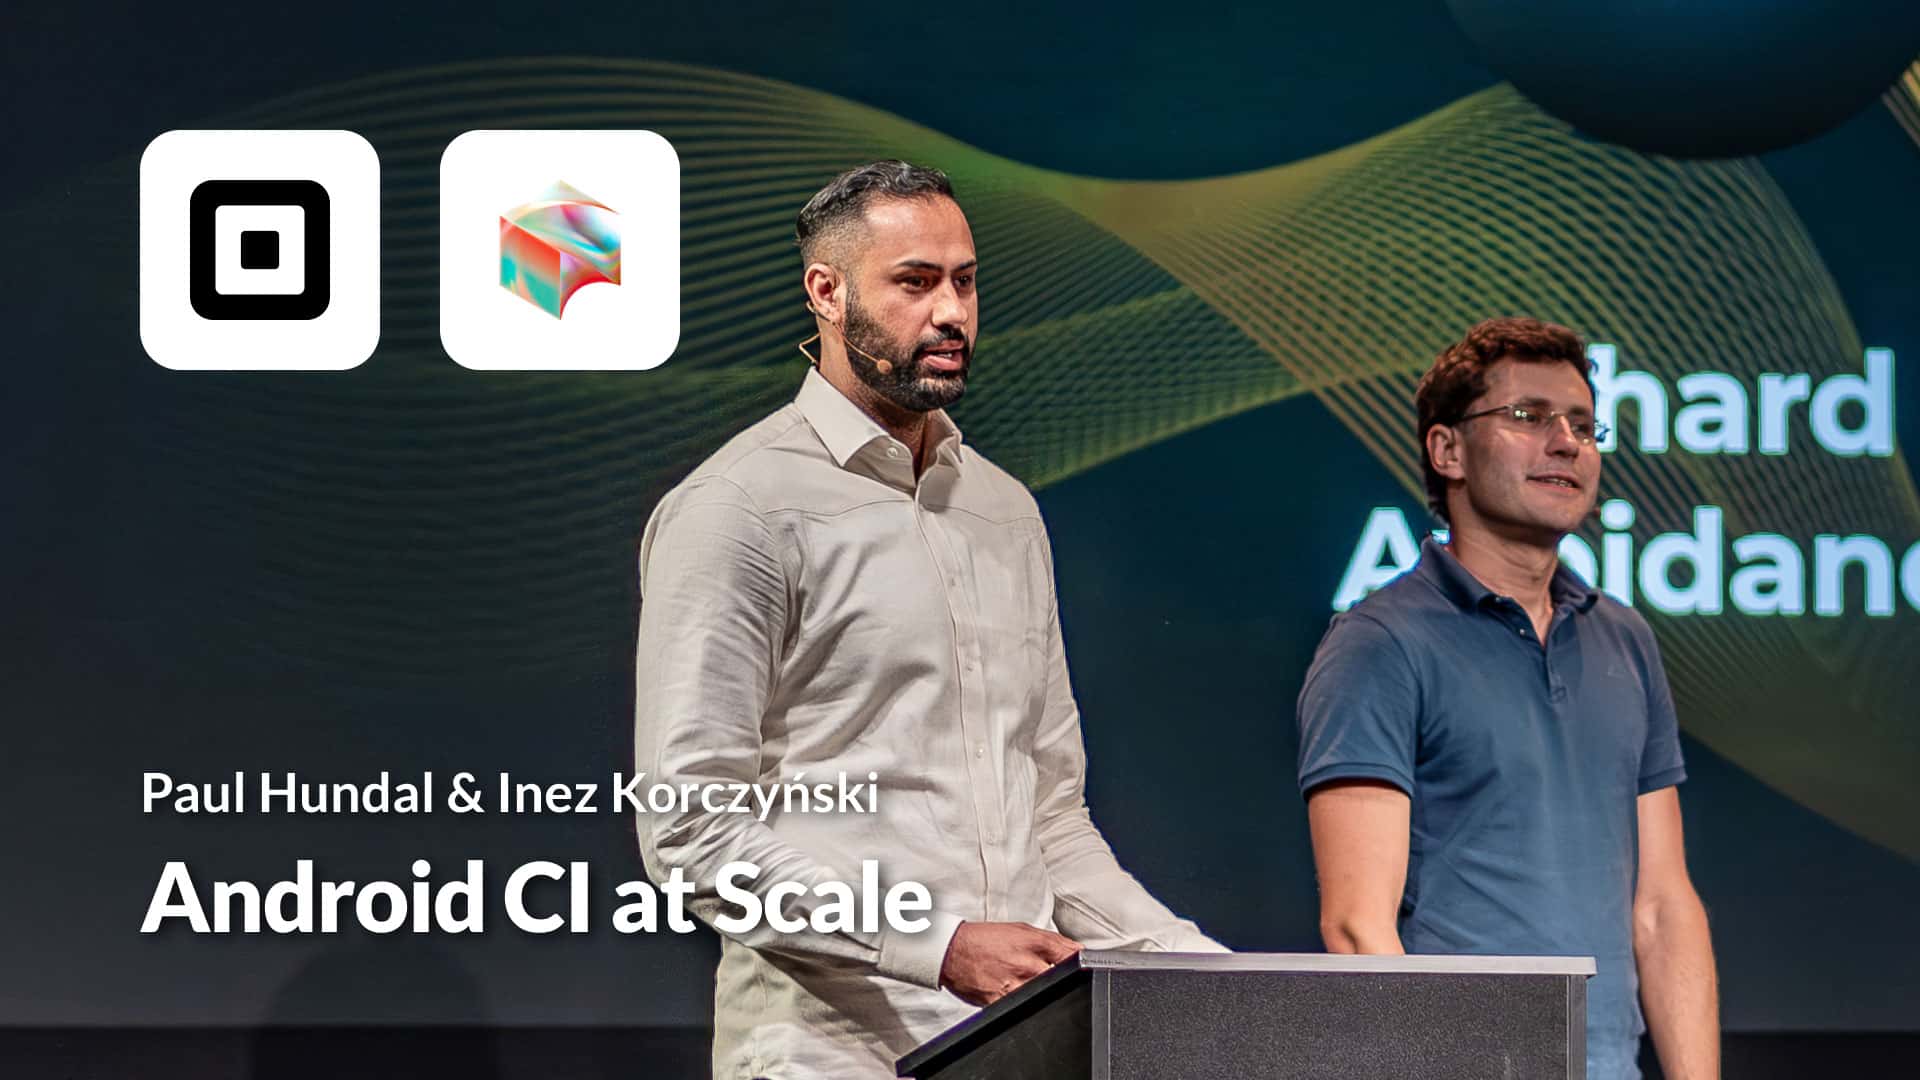
Android CI at Scale
Learn more about the CI team behind one of the largest Android application teams on the planet. Inez shares Block’s techniques for UI test avoidance. This includes decompiling the apk/test apks and taking hash of those, and when they determine that they already tested those combinations, they skip the UI tests. This technique minimizes the set of CI shards that need to run and resulted in 50% of shards skipped.
Watch the video
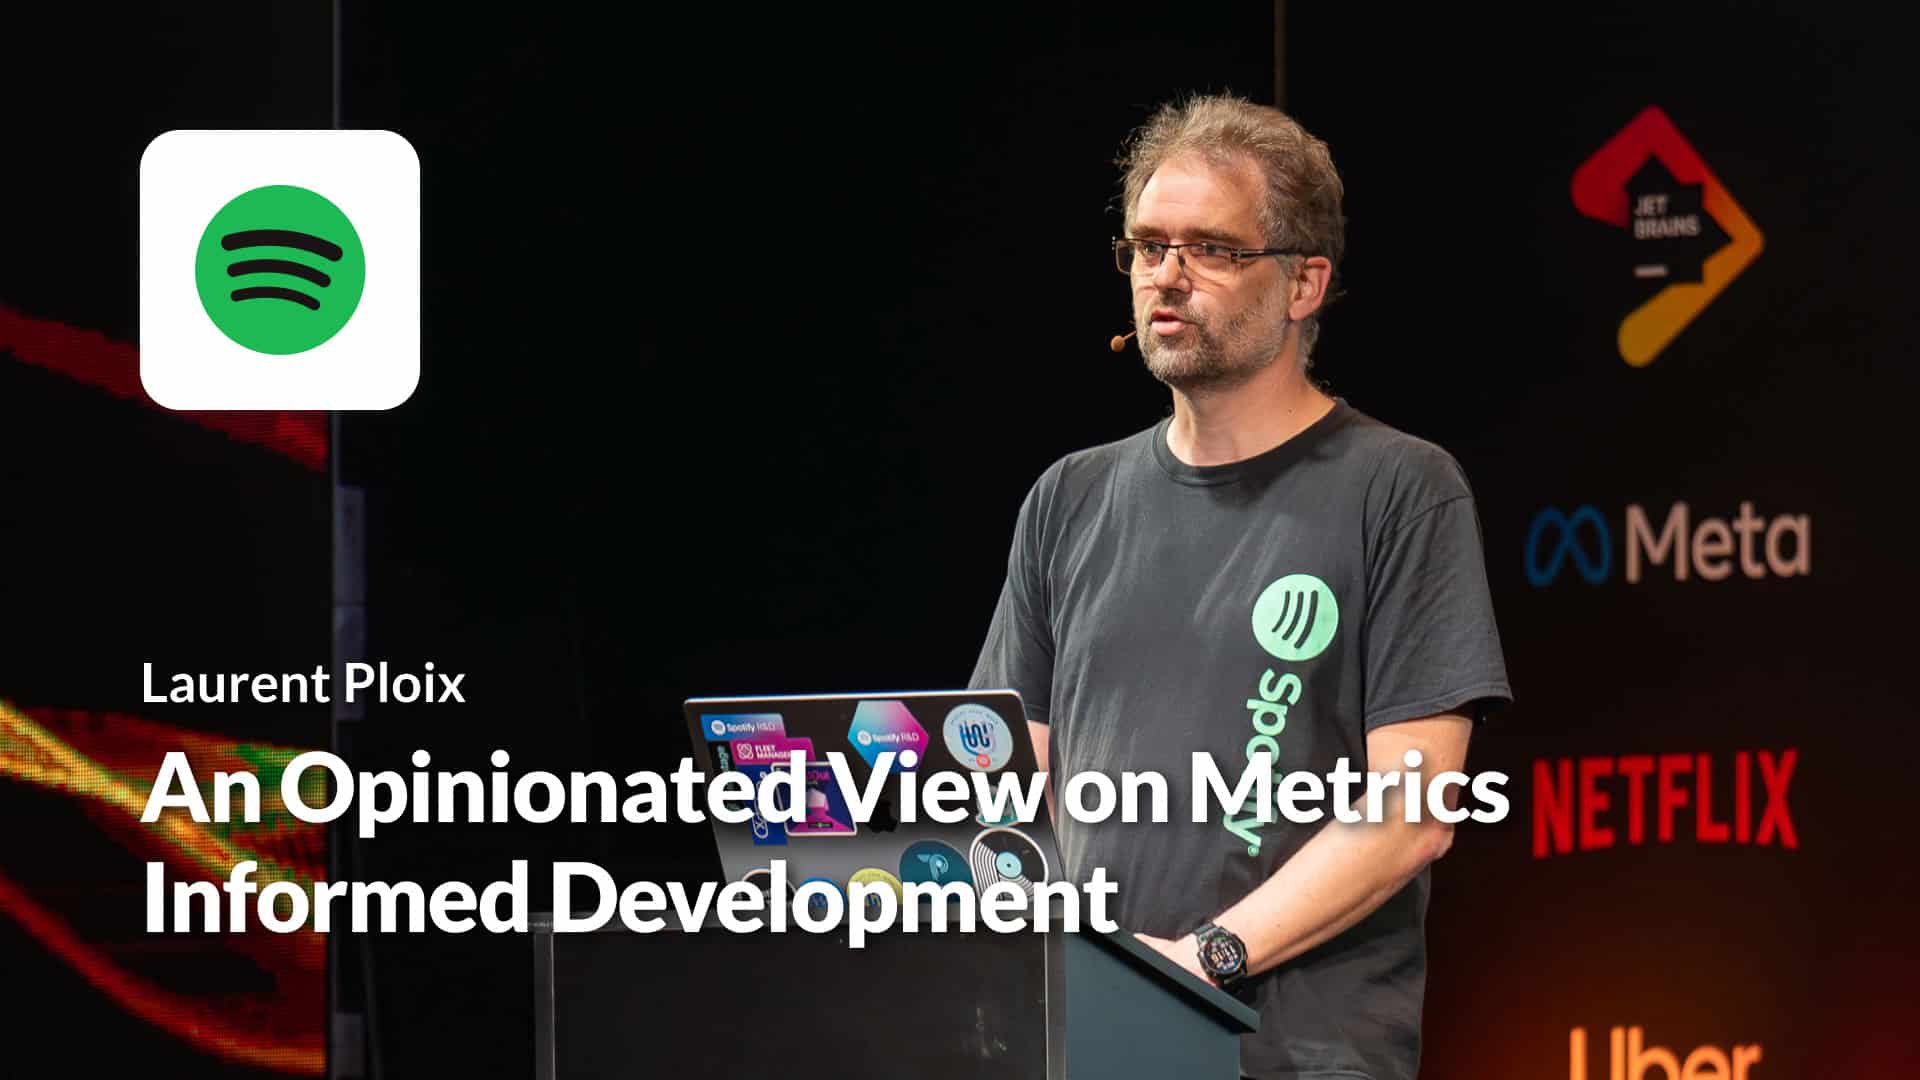
An Opinionated View on Metrics Informed Development
Laurent explores the challenge of aligning metrics between developers and executives. Leveraging self-reported developer productivity metrics, his team at Spotify distinguishes between leading metrics (short-term actions) and lagging metrics (long-term impact)—with the goal of connecting actions to long-term gains and avoiding “vanity” productivity measures.
Watch the video
Build Health and Velocity Score: How Pinterest Tracks the State of Builds
Manuel shares how the Pinterest mobile team tracks local/CI build times, CI up time, and other build metrics to measure the state of builds. They label builds with a number and letter grade to determine build health.
Watch the video
Android CI at Scale
Learn more about the CI team behind one of the largest Android application teams on the planet. Inez shares Block’s techniques for UI test avoidance. This includes decompiling the apk/test apks and taking hash of those, and when they determine that they already tested those combinations, they skip the UI tests. This technique minimizes the set of CI shards that need to run and resulted in 50% of shards skipped.
Watch the video
How Improving the Testing Experience Goes Beyond Quality: A Developer Productivity Point of View
If you’re interested in faster tests, flaky test detection/remediation, remote test execution, and predictive test selection, this talk is for you. Pro Tip: How they rolled out Develocity’s Predictive Test Selection AI/ML technology to save 107 days of test execution time in the first month is quite interesting.
Watch the video
Moving Fast While Delivering High Quality Code
Rui from Meta navigates the complexities of measuring developer productivity. He critiques DORA and SPACE metrics, suggesting a three-pronged approach: Velocity, Reliability, and Code Readability. He explores academic research on test productivity, dead code removal, and defining code readability.
Watch the video
CI Acceleration at Scale – A JPMC Success Story
The JPMC toolchain team reveals the DPE challenges of supporting 40k+ developers across 100k+ repos. They share how they measure CI quality of service in terms of predictability, reliability, and developer experience, and how they implemented a developer experience platform.
Watch the video
AI + Engineering = Magic at Airbnb
Szczepan at Airbnb asks: Does AI actually make our developers more productive? His team set out to test this theory by trying different developer productivity use-cases with AI tools like ChatGPT and GitHub Copilot. Seeing some early successes, they created their own custom AI model called One Chat, specifically designed to help Airbnb developers be more productive.
Watch the video
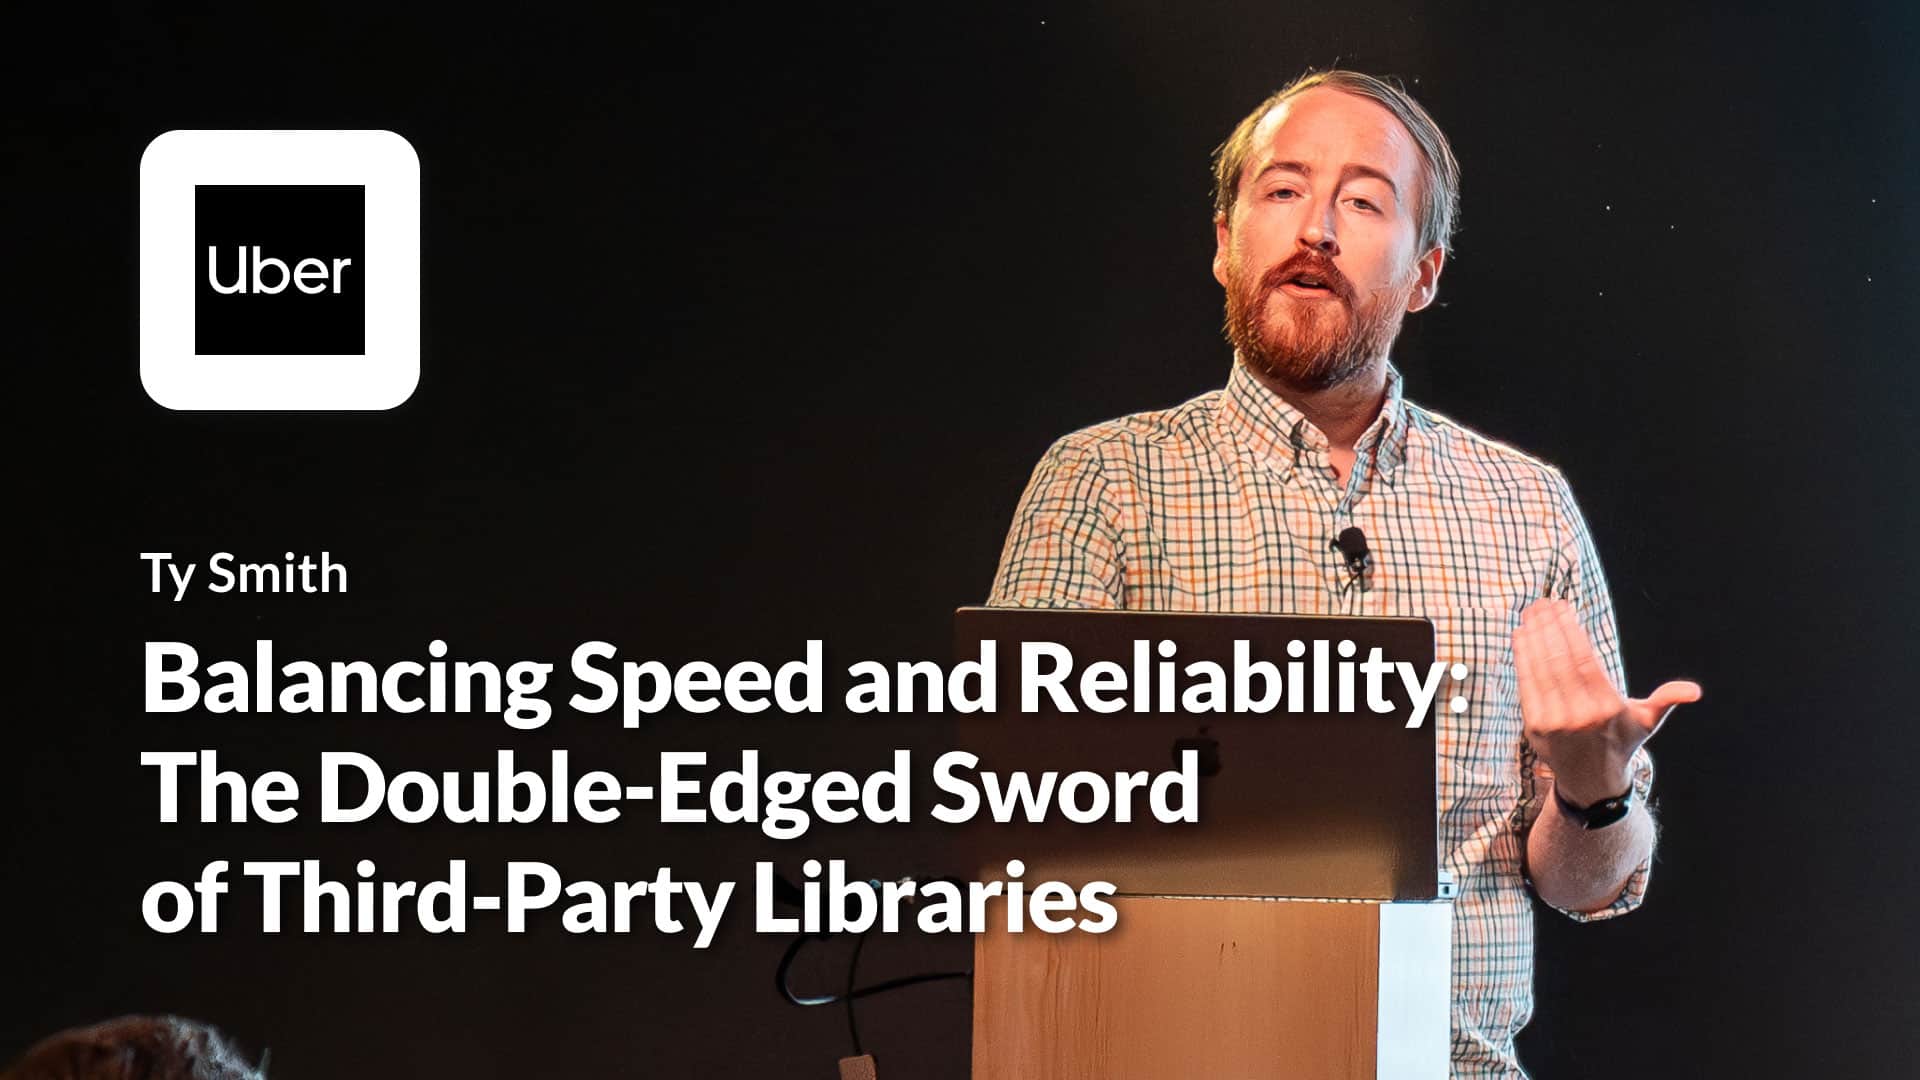
Balancing Speed and Reliability: The Double-Edged Sword of Third-Party Libraries
Ty at Uber shares real-life stories that most developers can relate to, as well as lesson learned the hard way: a crash in third-party code means a crash in your app. Ty shows how his team balances risk and reward with actual code examples that Uber uses to prevent bugs, dependency conflicts, and other issues before they can exact a real toll.
Watch the video
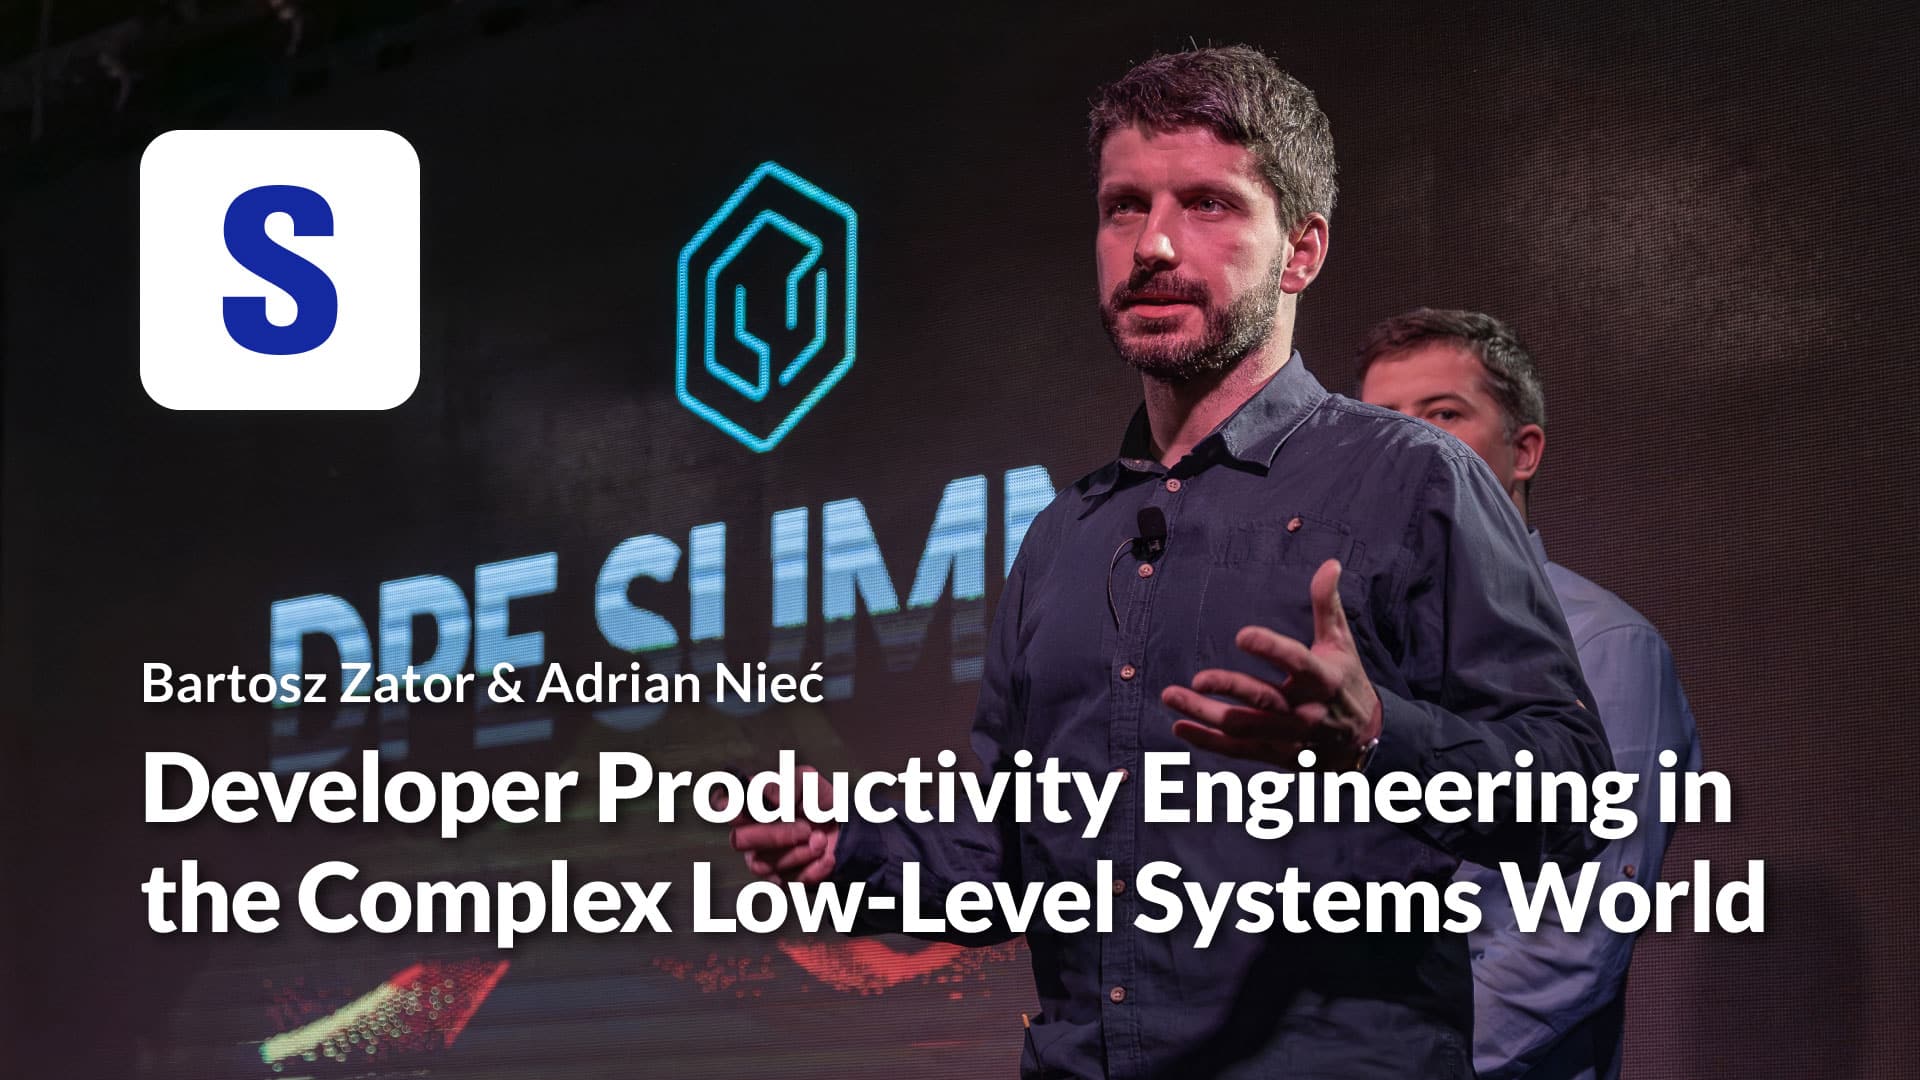
Developer Productivity Engineering in the Complex Low-Level Systems World
For Adrian and Bartosz at Samsung, software running on embedded systems—powering mobile phones, cars, and IoT devices—presents complex needs that require a specialized approach to DPE. In this talk, learn why Samsung created Code Aware Services (CAS) to bring forward data about builds and source code to further refine their developer productivity metrics and initiatives.
Watch the video
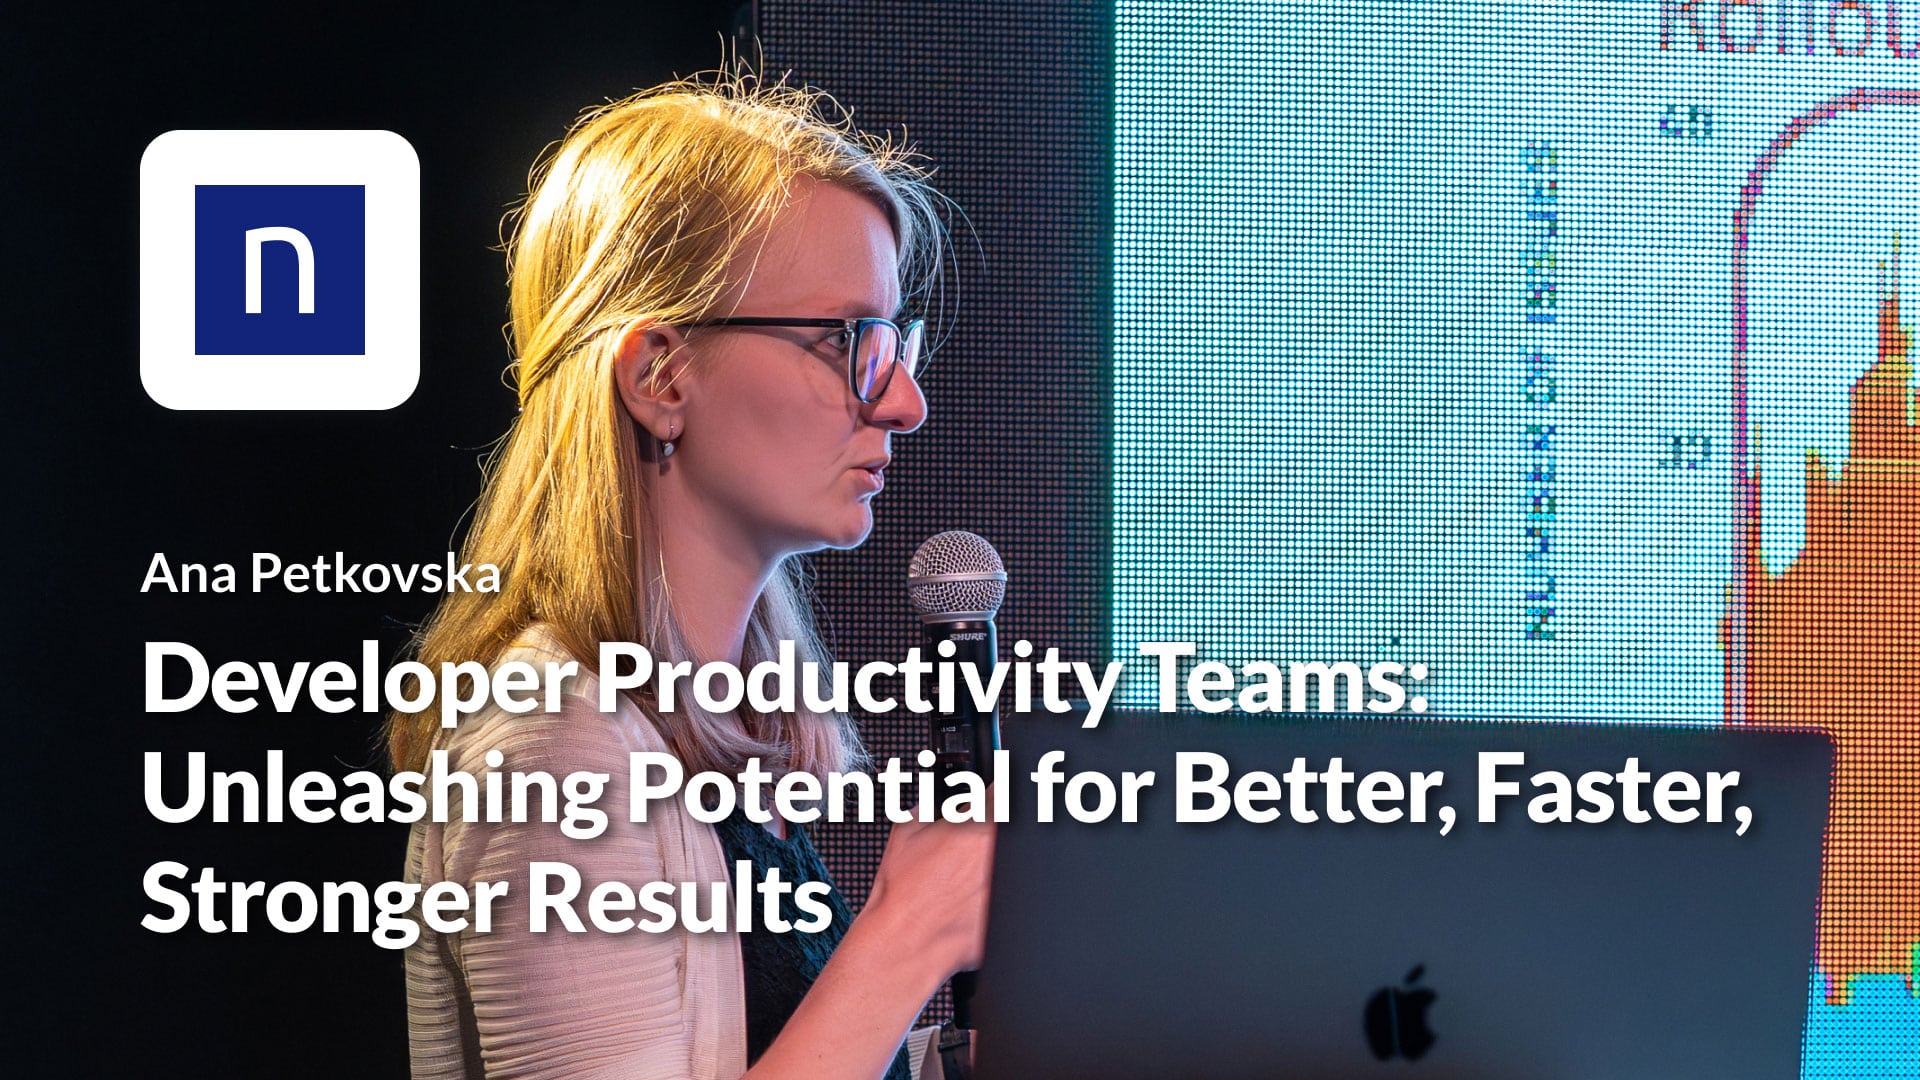
Developer Productivity Teams: Unleashing Potential for Better, Faster, Stronger Results
Ana at Nexthink describes their dedicated developer productivity organization which prioritizes developer feedback based on regular surveys that offer data-driven insights. By investing in boosting engineers’ satisfaction and productivity, they’ve expedited feedback cycles and created an easier onboarding experience via internal self-service platforms.
Watch the video
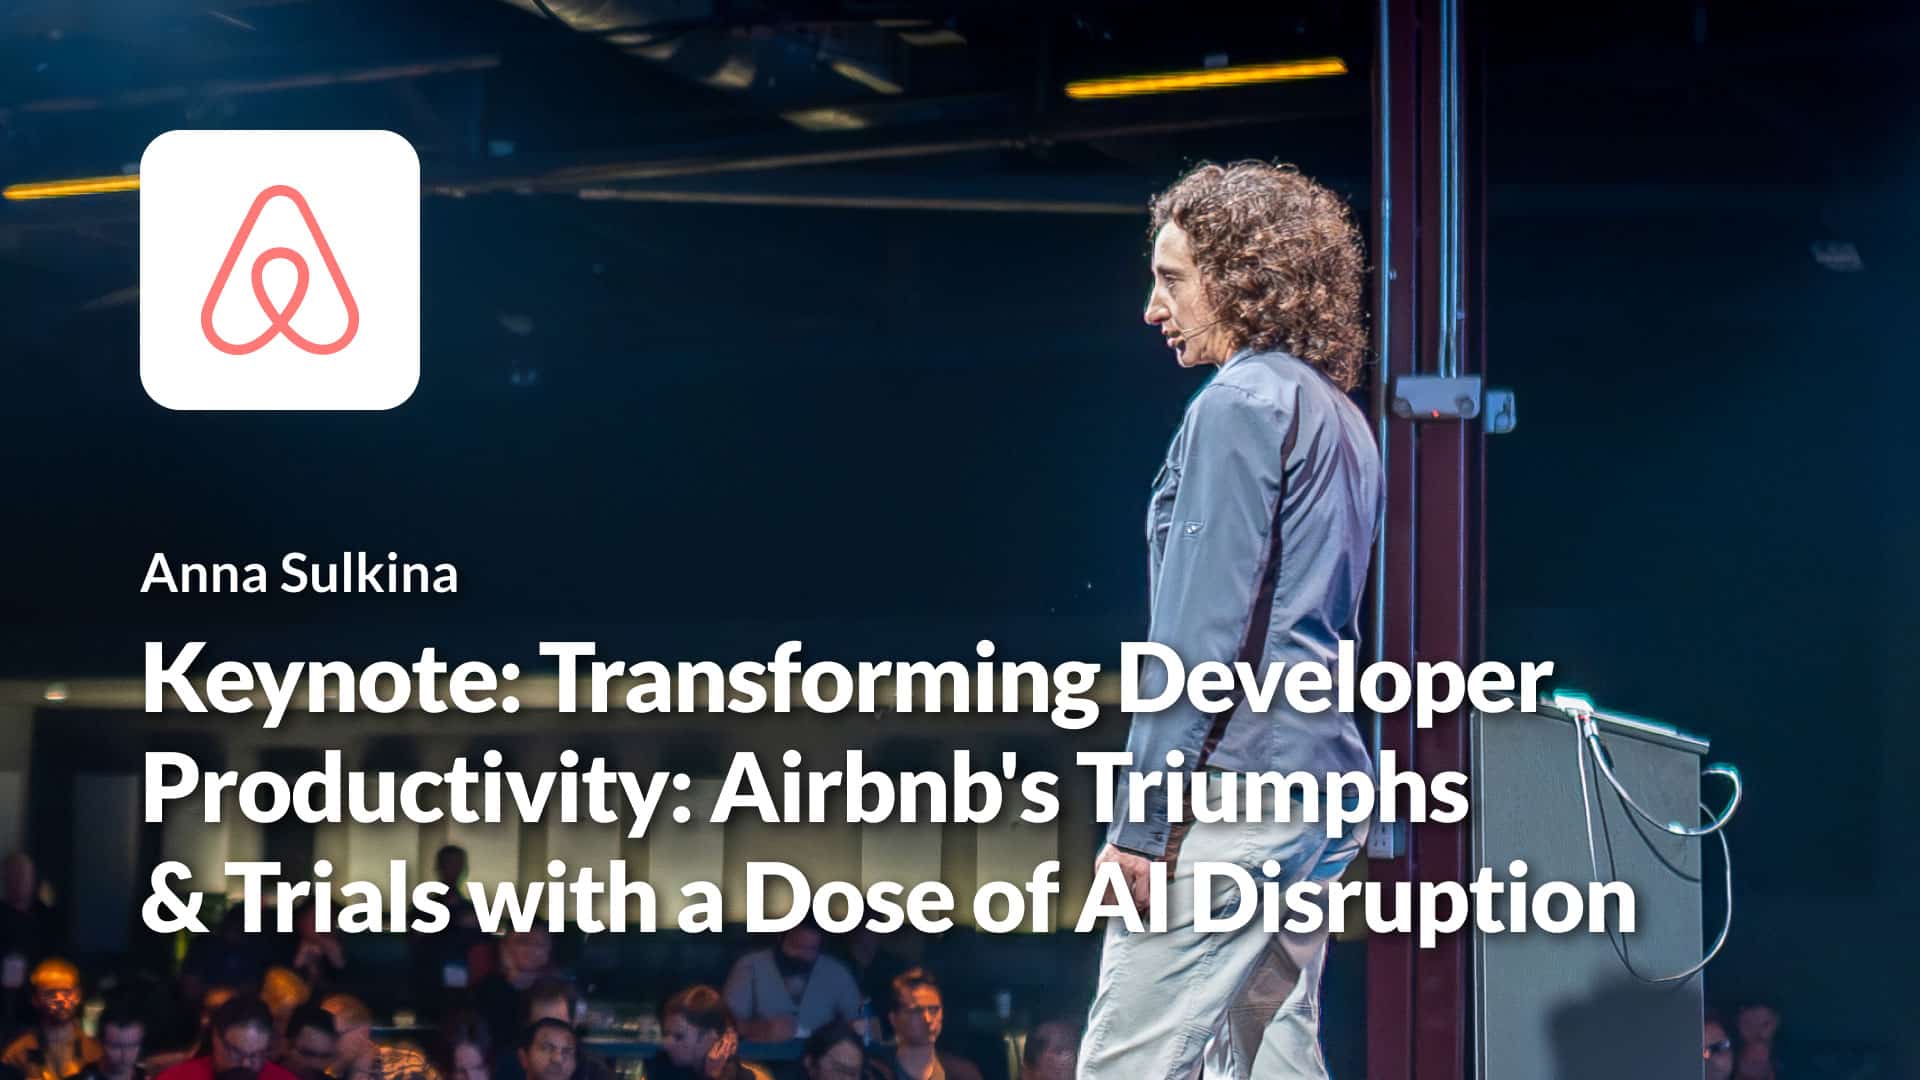
Transforming Developer Productivity: Airbnb’s Triumphs and Trials with a Dose of AI Disruption
Anna’s keynote unveils Airbnb’s DPE best practices: internal surveys for gauging developer productivity, DevX metrics for tracking progress, and Airdev—an internal platform for reducing cognitive load on developers that helps tackle issues like slow feedback loops and flaky tests.
Watch the video
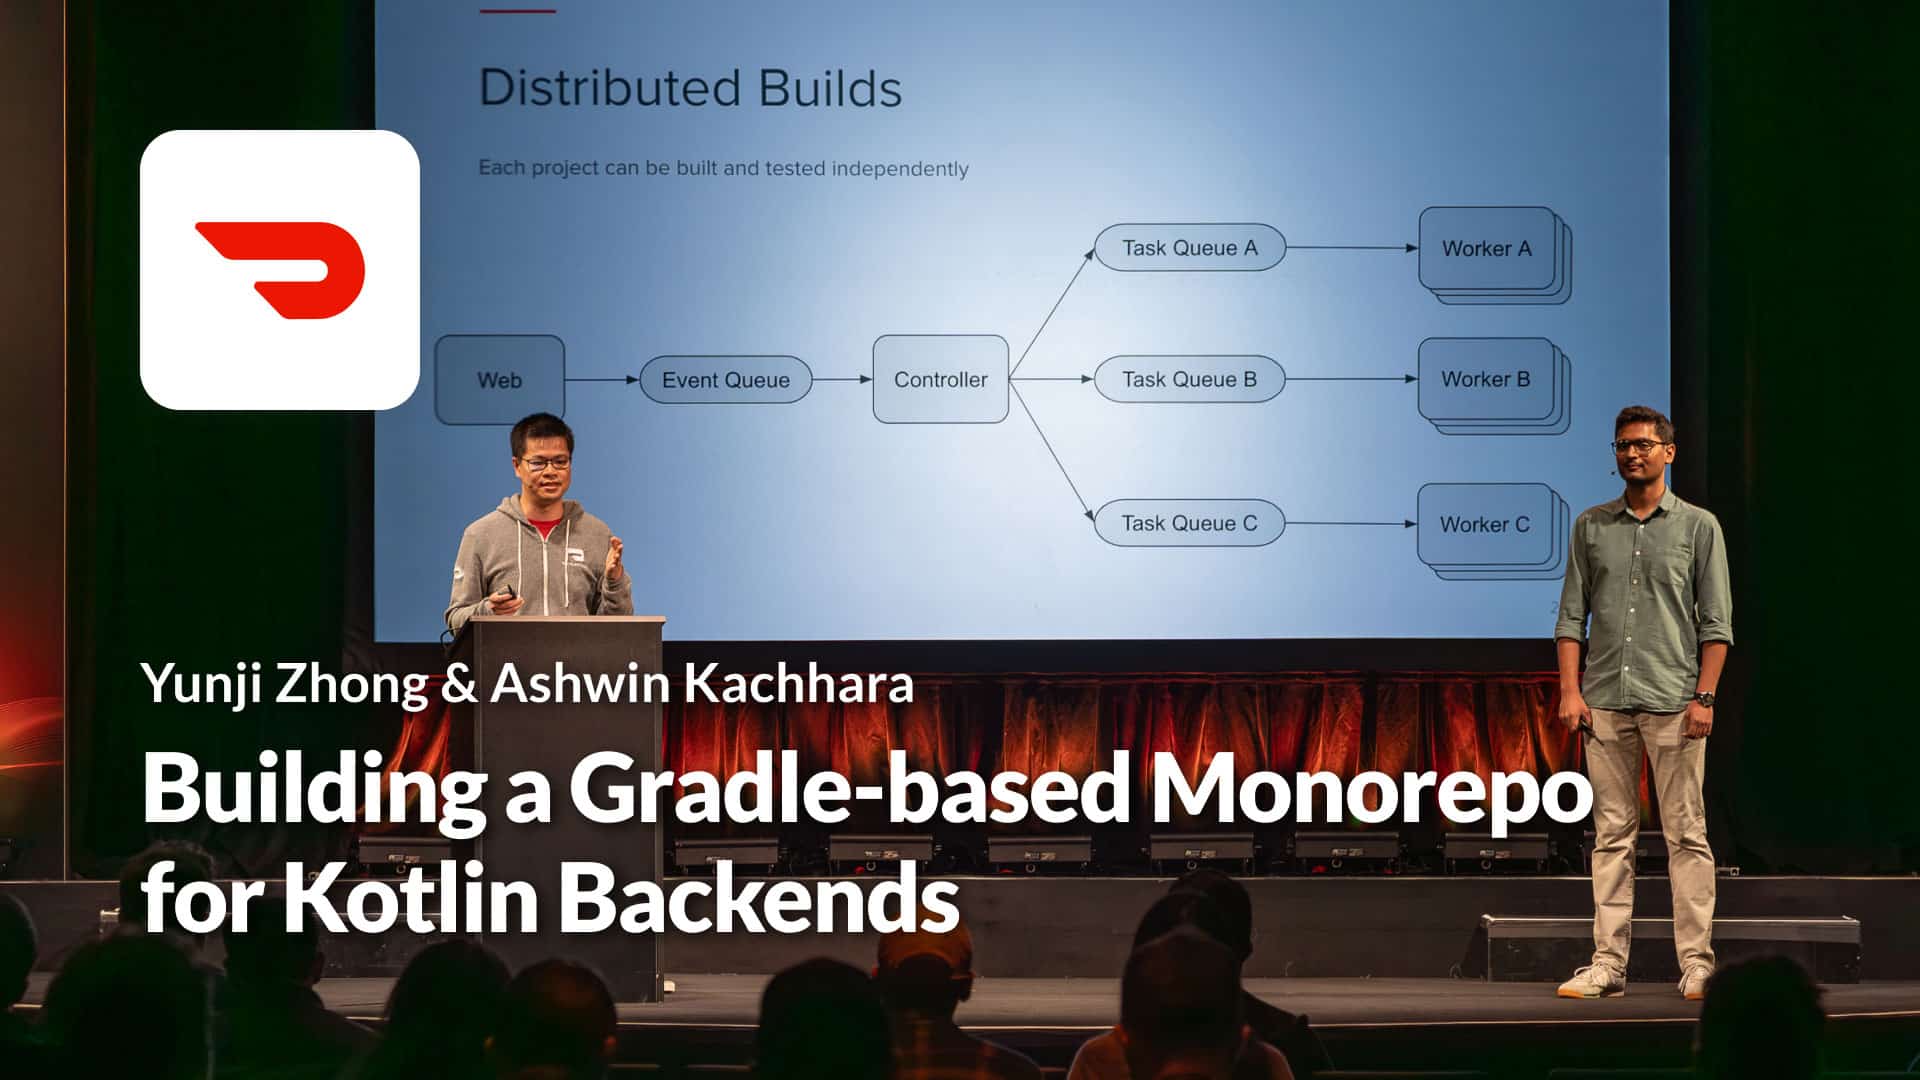
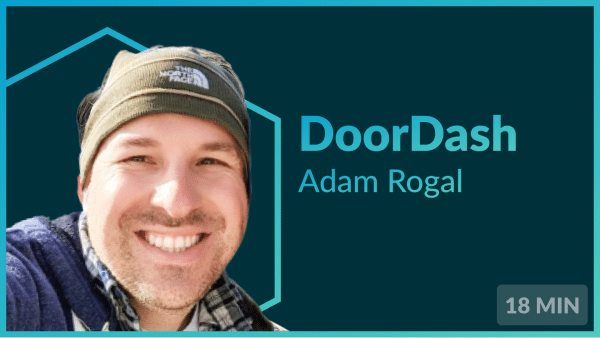
Building a Gradle-based Monorepo for Kotlin Backends
The Doordash team share their experiences exploring Gradle vs Bazel for building a mono repo. They share the challenges they faced and how certain Gradle Build Tool features helped solve them. They discuss custom plugins, composite builds, and version catalogs. If you’re working on builds/tests in large repos, this talk is for you.
Watch the video

Developer Productivity Engineering in the Complex Low-Level Systems World
For Adrian and Bartosz at Samsung, software running on embedded systems—powering mobile phones, cars, and IoT devices—present complex needs that require a specialized approach to DPE. In this talk, learn why Samsung created Code Aware Services (CAS) to bring forward data about builds and source code to further refine their developer productivity metrics and initiatives.
Watch the video
Embracing DORA Metrics: The Airbnb Journey Towards Enhanced Developer Productivity
Christopher at Airbnb describes his experience with DORA metrics and identifies some DORA do’s and don’ts. For example, DORA is useful for developing a common language and starting conversations about developer productivity; however, it’s not ideal for gauging the success of specific projects. In that context, looking at build wait times, test pass rate, and work environment factors can be more meaningful.
Watch the video
From Myth to Legend: How Generative AI Can Supercharge Productivity to Create 10x Developers
Gautam and Serdar at Uber explore whether Generative AI can match the productivity of a “10x developer”. They discuss results using Generative AI for tasks like refactoring, maintaining tests, incident management, and documentation enhancement. Their analysis reveals that while Co-Pilot and other tools make developers feel more productive, they produce only an average of 1-2 lines of usable code.
Watch the video
Behind the Scenes of Productivity Metrics at LinkedIn
Grant from the LinkedIn developer insights team shares how they capture productivity engineering metrics from teams/products/projects at LinkedIn. Grant shares how they collect, aggregate, analyze, and visualize the metrics for engineering leaders and productivity champions. Grant also surfaces examples of impactful metrics, such as the median duration that PR authors wait for feedback in code reviews.
Watch the video
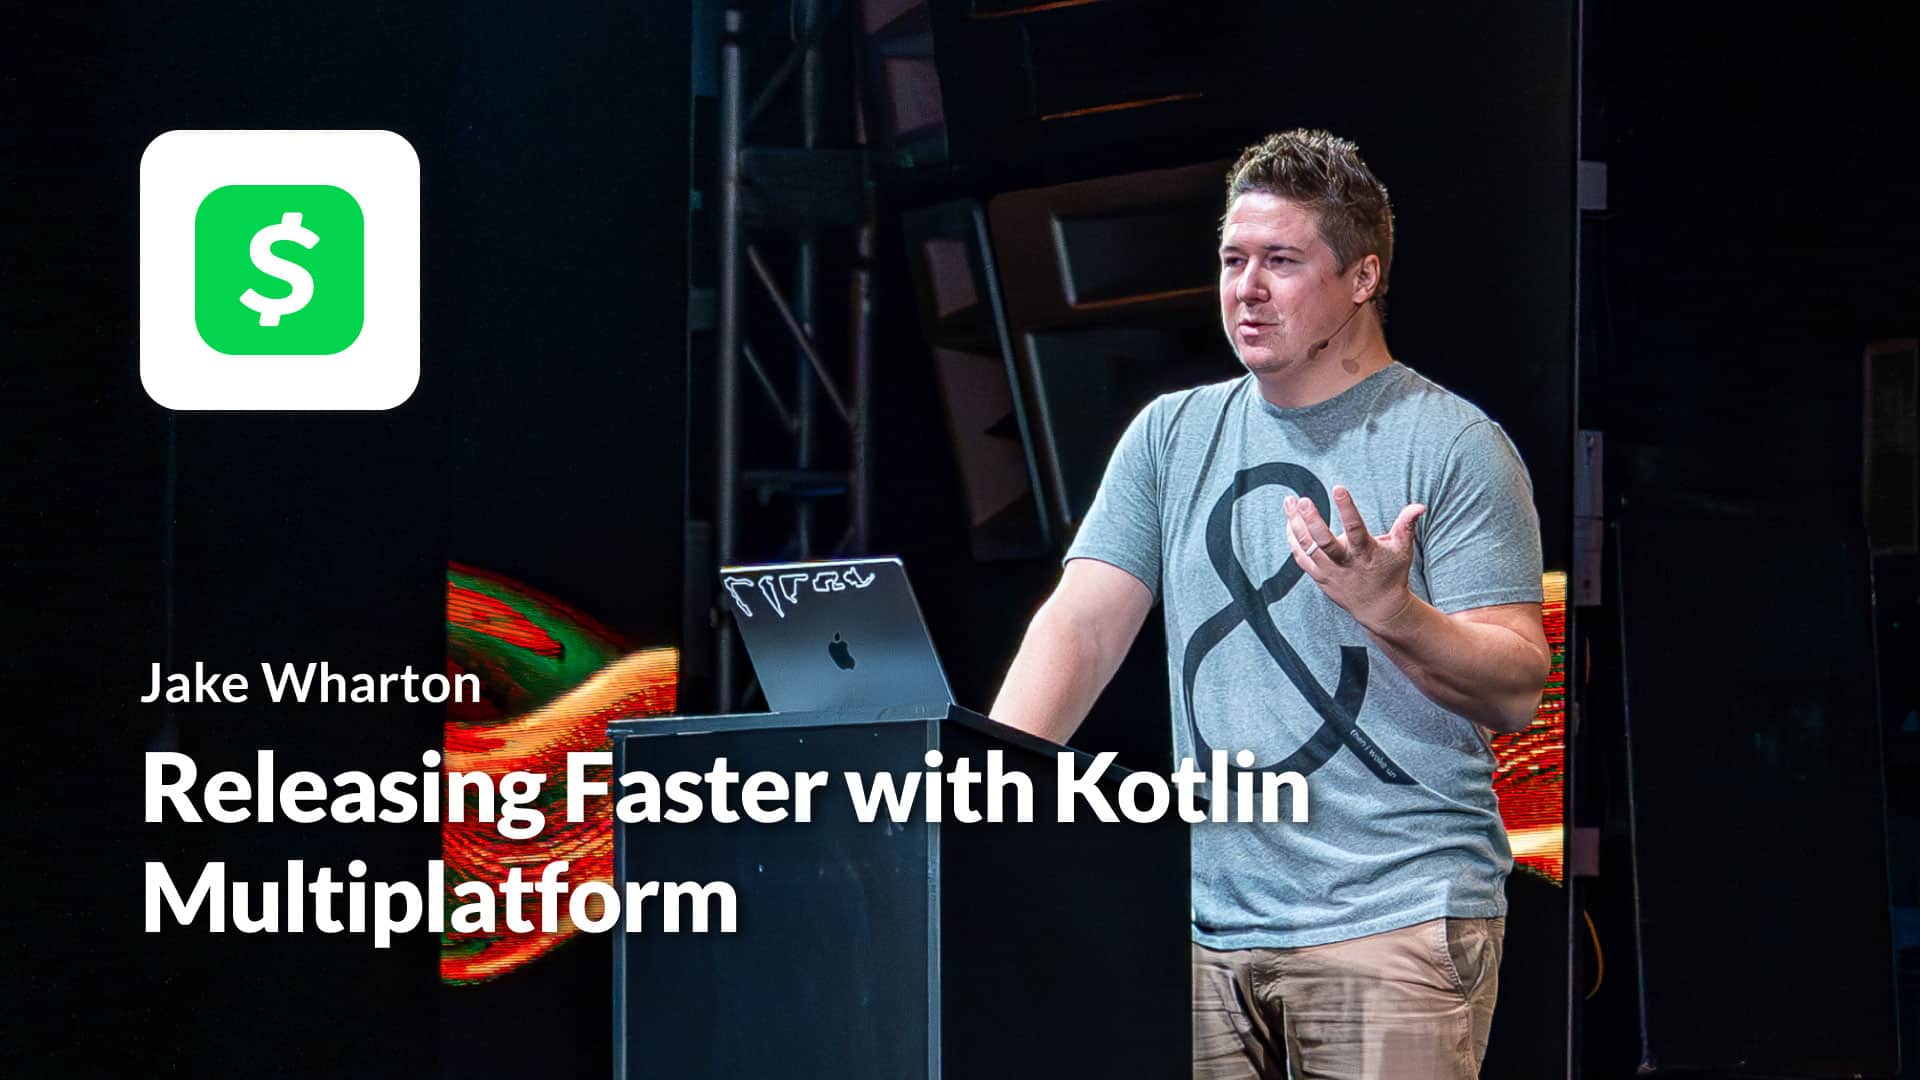
Releasing faster with Kotlin Multiplatform
Jake shares how previously the Cash App Android, iOS, and web apps were all developed natively, resulting in two-week release trains for mobile apps with 1-2 week rollout periods. By using Kotlin Multiplatform, they were able to substantially improve those deployment times to get their apps released faster.
Watch the video
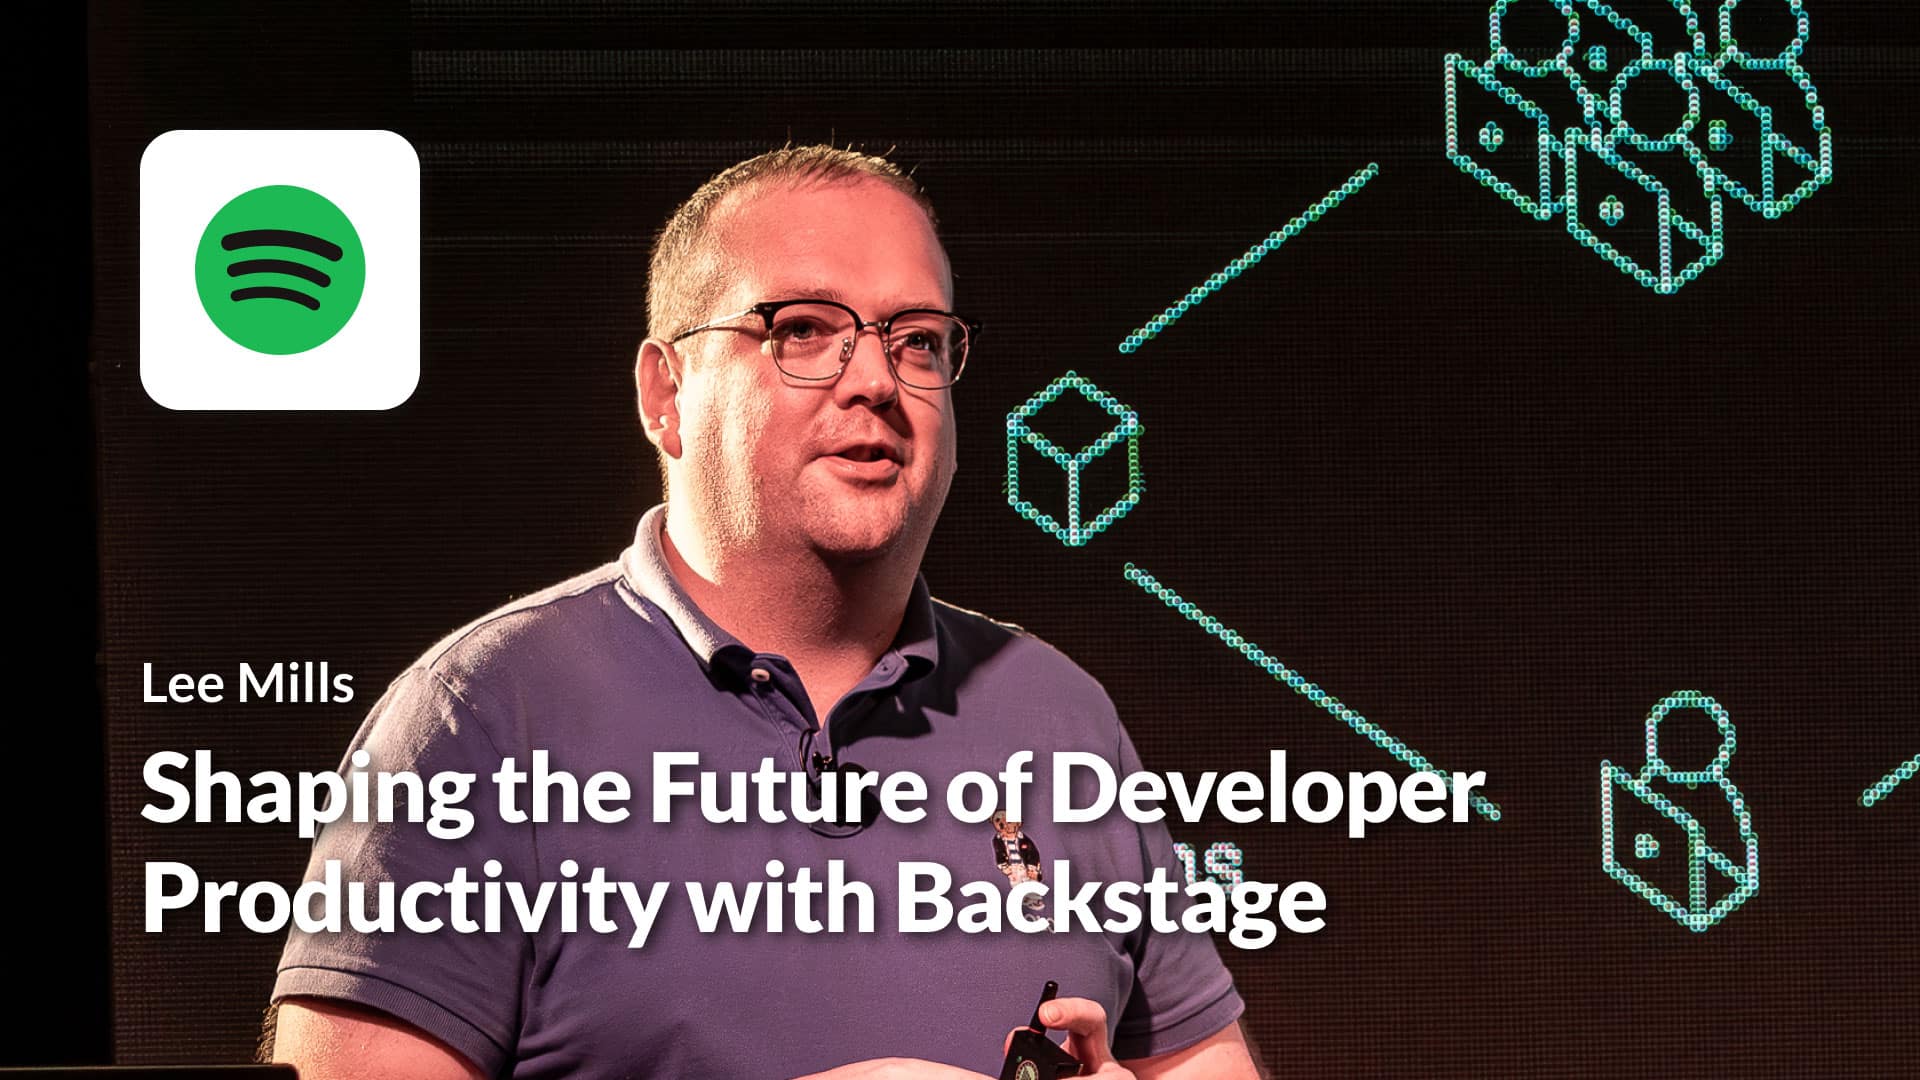
Shaping the Future of Developer Productivity with Backstage
Lee highlights Spotify’s dedication to DPE through their investment in Backstage, an internal developer portal that they later donated to the CNCF. Lee explains how Backstage—now supporting over 4 million external developers—aligns directly with a key DPE goal: to accelerate developer productivity by eliminating distractions and delays.
Watch the video
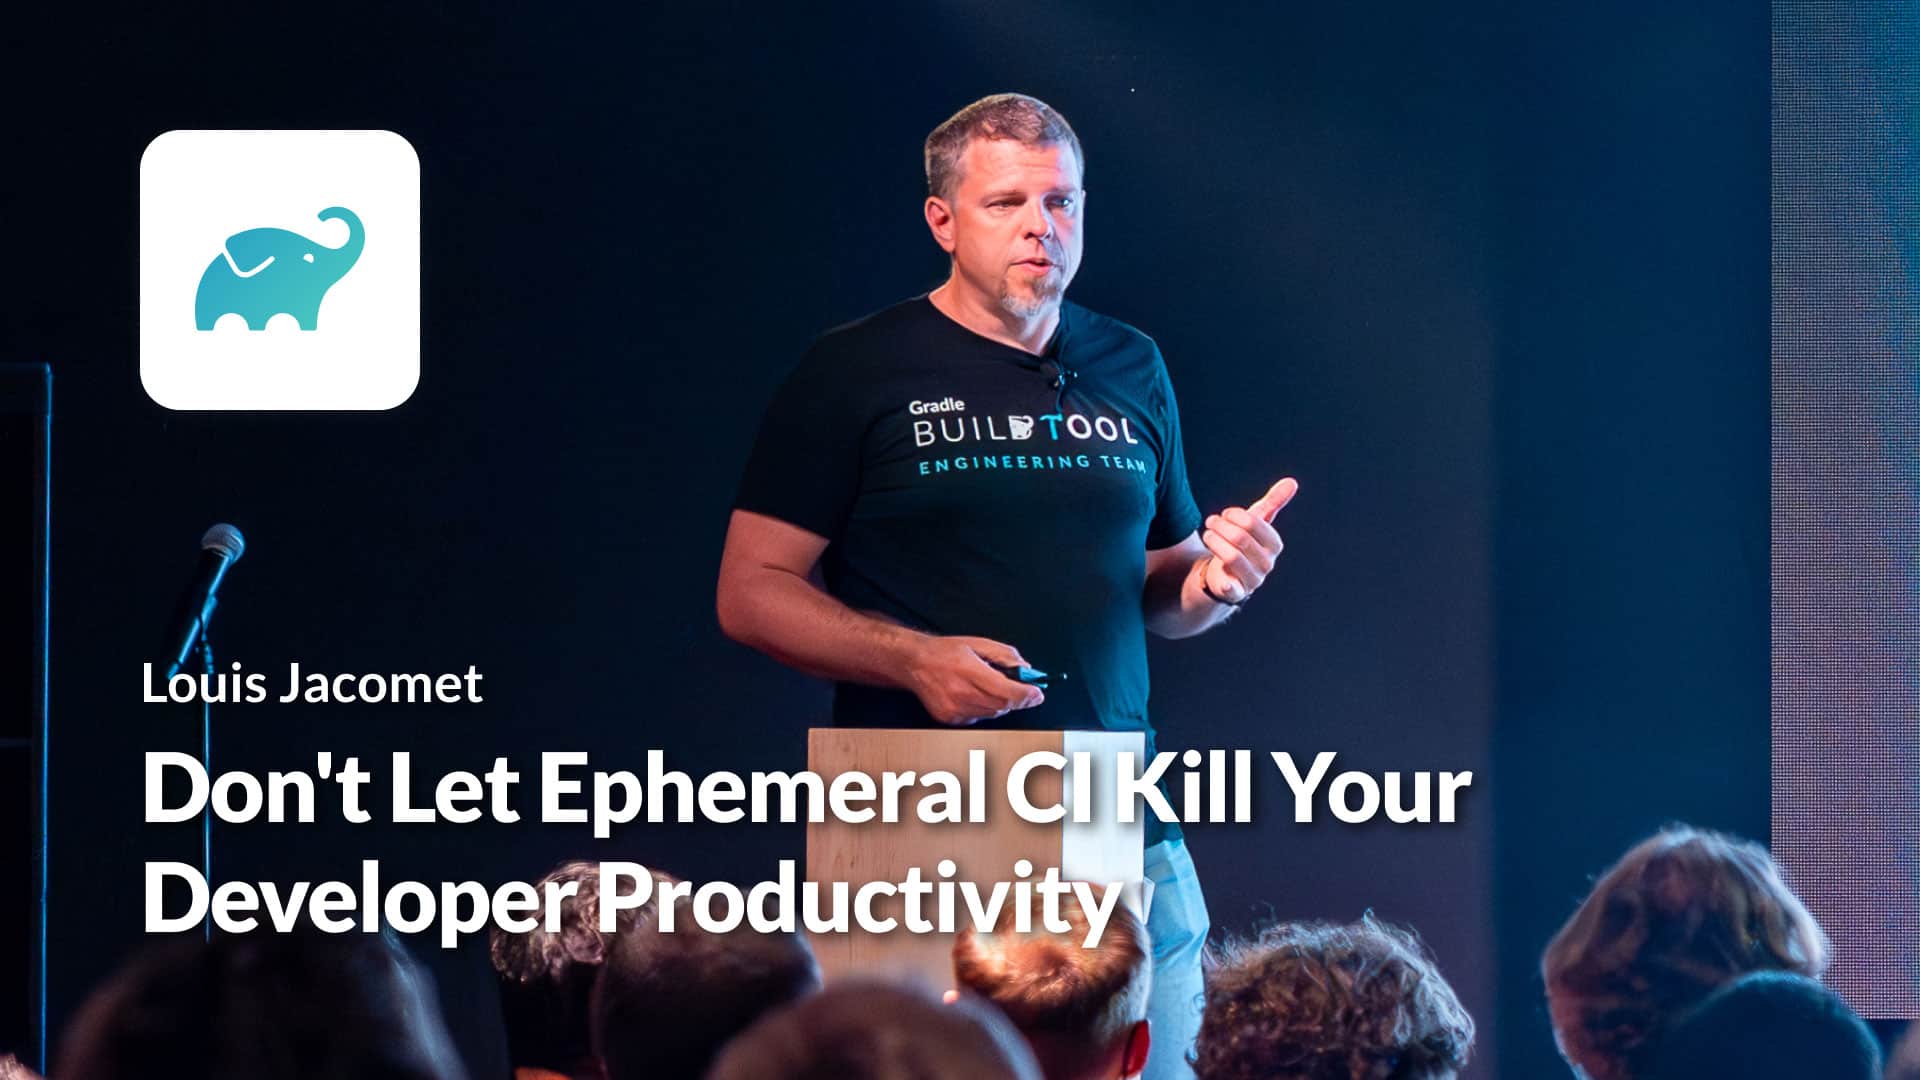
Don’t Let Ephemeral CI Kill Your Developer Productivity
Louis dives into how the standard performance optimizations that enhance developer productivity with Gradle Build Tool can be hindered in a stateless, ephemeral CI environment. He then shares which performance features make sense in these environments and walks through how to optimize Gradle Build Tool for various use cases.
Watch the video
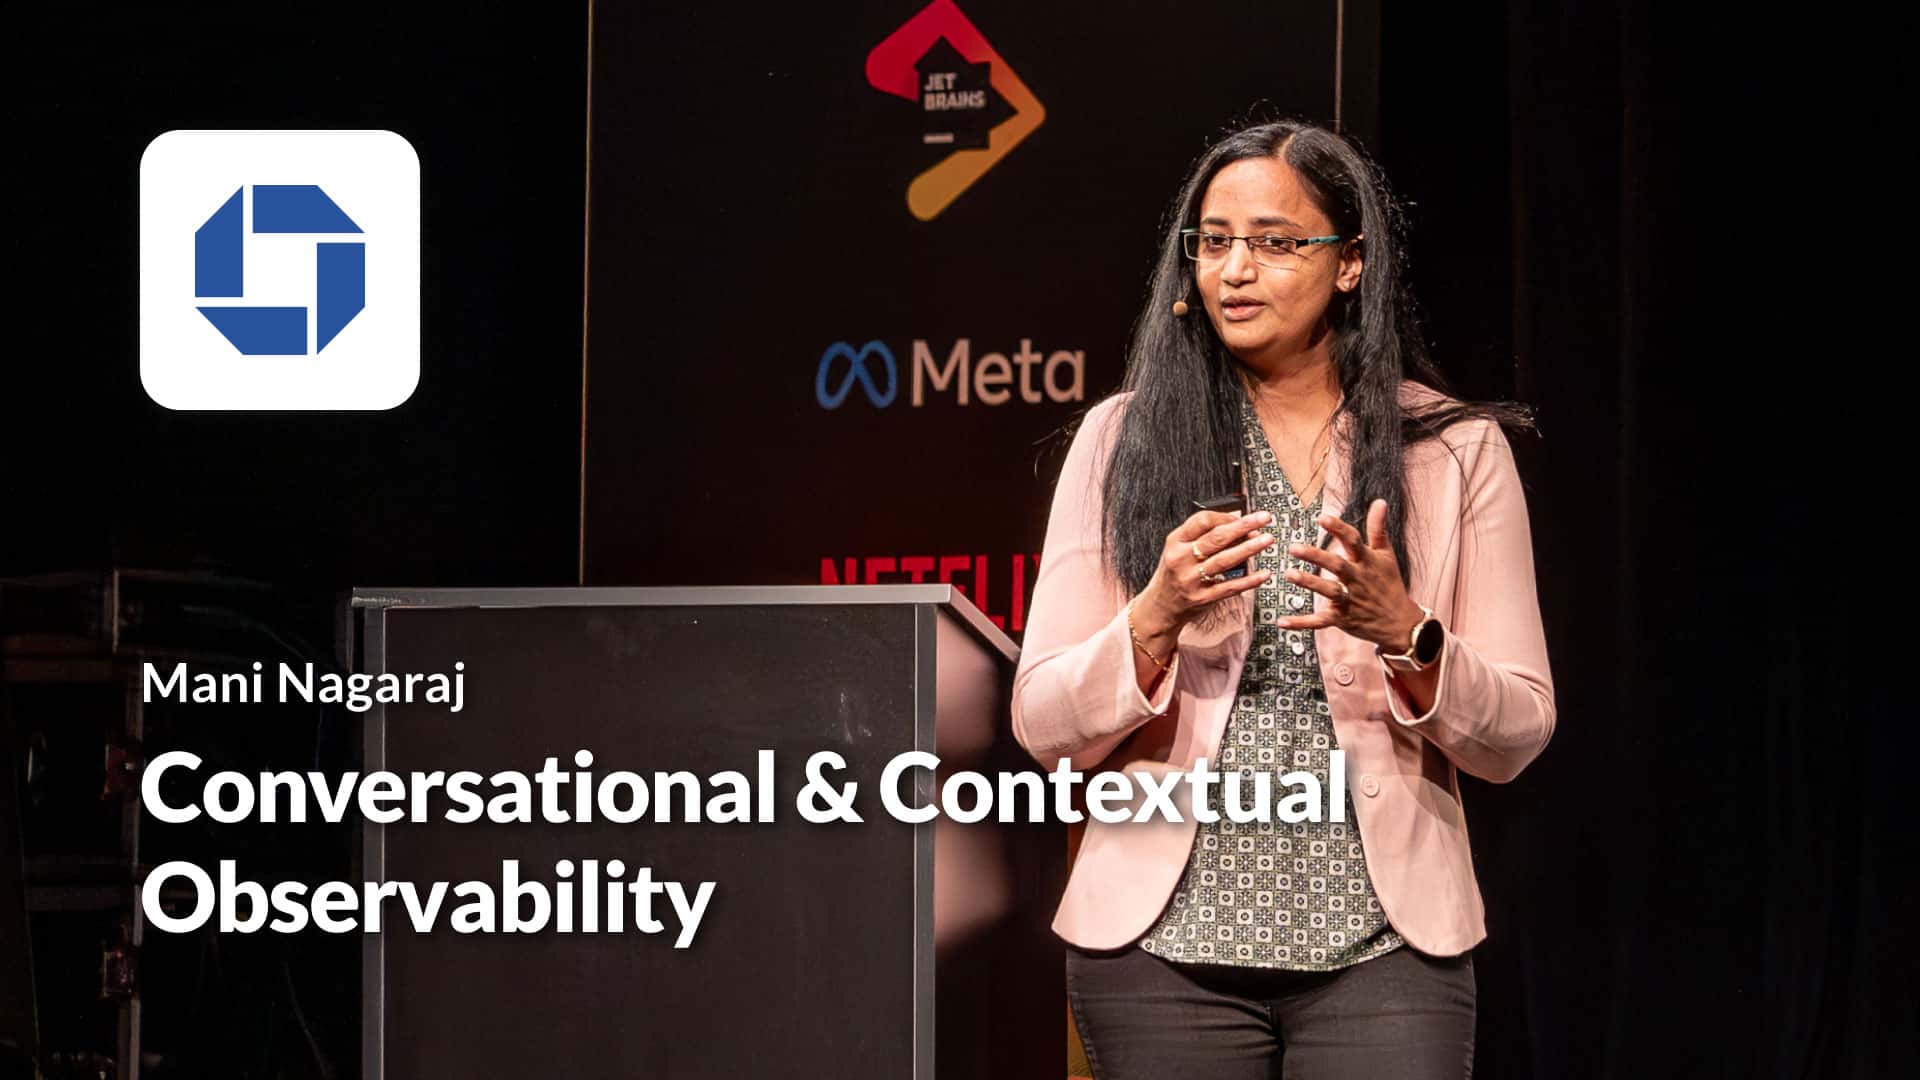
Conversational and Contextual Observability
The Engineering Platform and Integrated Experience team at JPMC tells their story about how they boosted developer productivity with LLMs. Leveraging metrics, traces, and logs, along with other data, they produced a self-service, natural language interface that assists developers, CI/CD engineers, product managers, and other stakeholders in rapidly discovering and applying insights to many sorts of queries.
Watch the video
How to Make Your Developers Unproductive and Unhappy
Max’s keynote humorously explores developer unproductivity, before describing some more serious DPE strategies like internal surveys, diverse team tooling, and flexible standards. His 20 years of insights may provide clues to finding your own successful path to DPE excellence.
Watch the video
Accelerating Builds with Buck2
Neil at Meta describes developer productivity using one of Meta’s internal build tools, Buck 2. He discusses performance improvements made since Buck 1, new features like abstraction through APIs, parallel and incremental compute, remote execution, and the use of virtual files to improve developer productivity.
Watch the video
Lessons in Tackling the IDE Performance
Block has one of the largest Android application development teams on the planet. They share how they managed their IDE scaling challenges while growing to 4500+ modules. Get their lessons learned from managing sync times, memory leaks, and more. If you have large projects and are struggling with IDE experience, this talk is for you.
Watch the video
Unlocking High-Velocity Development Strategies, Tactics, and Metrics
Ravikumar at Adobe discusses seven productivity factors for high-velocity teams, including internal developer platforms, tailored metrics from DORA and SPACE frameworks, and the role of Generative AI at Adobe. He emphasizes the positive impact of internal platforms for enhancing developer productivity as well as how Generative AI is beginning to transform DPE at Adobe.
Watch the video
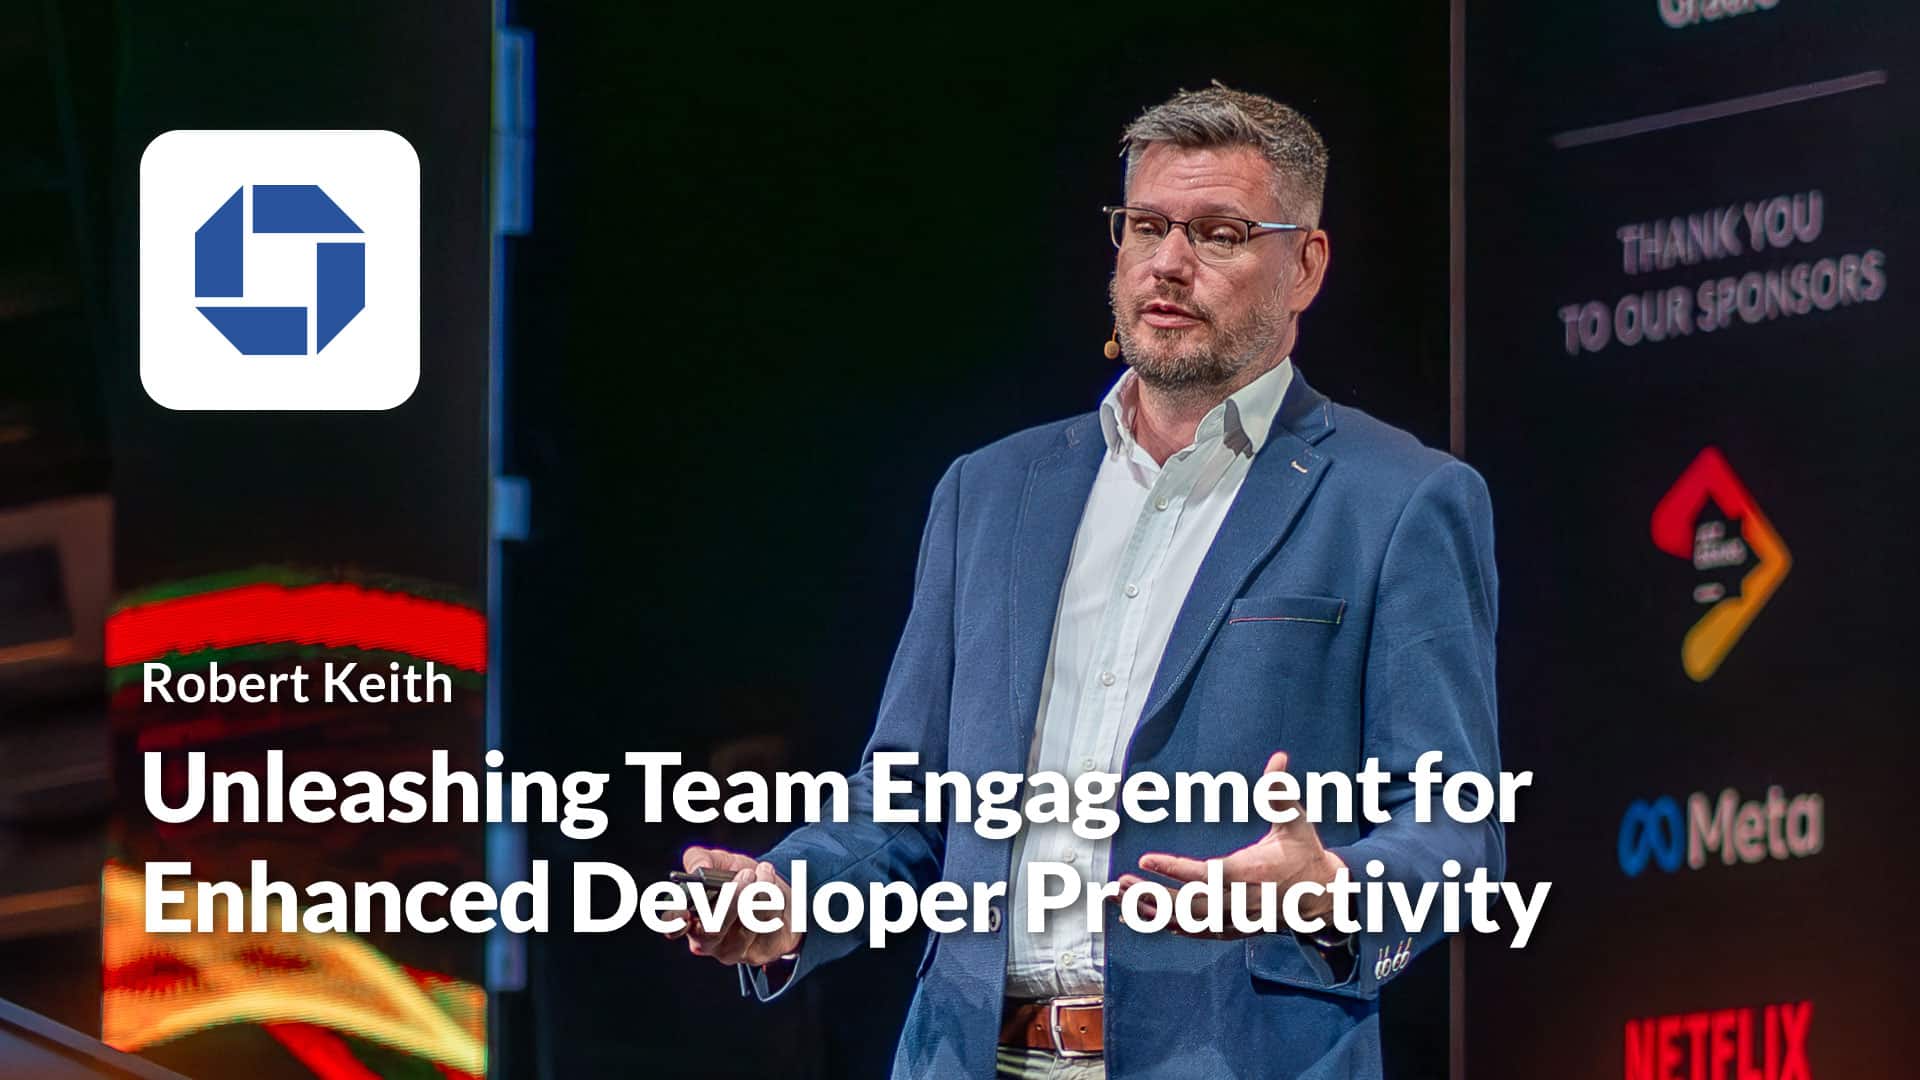
Unleashing Team Engagement for Enhanced Developer Productivity: Empowering Engineers Beyond Technical
Rob from JPMC shares his lessons-learned from capturing developer experience metrics across their developer organization. He shares what metrics led to developer happiness and how those metrics impacted job satisfaction and productivity.
Watch the video
From Myth to Legend: How Generative AI Can Supercharge Productivity to Create 10x Developers
Gautam and Serdar at Uber explore whether Generative AI can match the productivity of a “10x developer”. They discuss results using Generative AI for tasks like refactoring, maintaining tests, incident management, and documentation enhancement. Their analysis reveals that while Co-Pilot and other tools make developers feel more productive, they produce only an average of 1-2 lines of usable code.
Watch the video
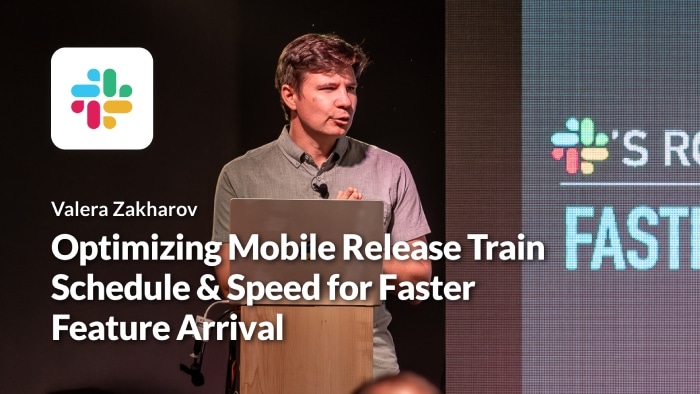
Optimizing Mobile Release Train Schedule and Speed for Faster Feature Arrival
Valera explains why ad hoc code cleanup doesn’t scale. He shares his team’s lessons-learned from handling tech debt at Slack with a code health score system. The impact of the Slack health score case study and their stats on pull requests is particularly interesting. Pro Tip: code health and tech debt impacts developer happiness.
Watch the video

Building a Gradle-based Monorepo for Kotlin Backends
The Doordash team share their experiences exploring whether to use Gradle vs Bazel for building a mono repo. They share the challenges they faced and how certain Gradle Build Tool features helped solve them. They discuss custom plugins, composite builds, and version catalogs. If you’re working on builds/tests in large repos, this talk is for you.
Watch the video